Investigating Boston Police Department SWAT Raids from 2012 to 2020
Today, the ACLU of Massachusetts released a new interactive tool allowing members of the public to visualize and analyze nearly a decade of Boston Police Department SWAT team after-action reports. An ACLU analysis of these reports has identified troubling racial disparities in BPD SWAT raids, particularly when those raids involve drug investigations.
Review Boston Police SWAT After-Action Reports
About the data
This analysis draws on after-action reports of BPD SWAT incidents from 2012 to May 2020. After-action reports are created by the BPD SWAT team to document the unit’s deployments. The reports include descriptions of the incident, information about the people involved (the police, targets, and others impacted), the geographic location of the deployment, and details about the level of police force used during the SWAT action, among other details. The BPD released these reports in response to a 2020 subpoena from then-City Councilor Michelle Wu.
Unfortunately, the documents produced by the BPD were difficult to analyze in bulk; among other problems, they were not machine readable. While the ACLU and our partners made every attempt to ensure the accuracy of the data pulled from these reports, our analysis has some data limitations. For example, the underlying after-action reports occasionally include missing, clearly incorrect, or difficult-to-interpret data. As explained in greater detail in the methodology section at the bottom, some errors may also have arisen in our processing of the records and extraction of information. That said, we engaged in a human review of the documents to ensure any errors in our extraction do not impact the overall analysis of trends.
The data: Disproportionate SWAT policing of Black and Brown communities and people
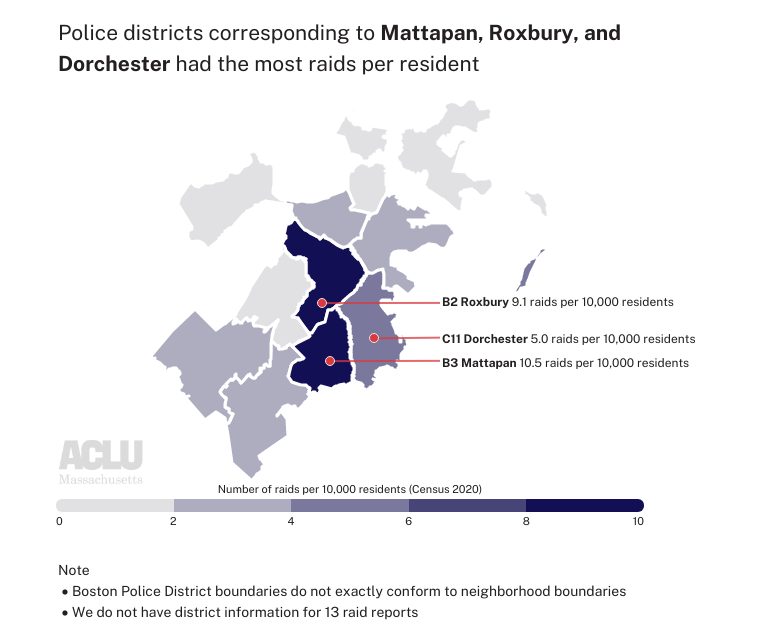
There are 262 after-action incident reports representing deployments between 2012 and May 2020. A significant portion of these police actions took place in police precincts roughly corresponding to the neighborhoods of Mattapan, Roxbury, and Dorchester.
According to data reported by the Boston Planning & Development Agency Research Division, these three neighborhoods had the highest percentage of residents who are non-white (i.e., identifying as a race other than white or as white along with one more other races) of any Boston neighborhood in 2020. These neighborhoods also had a relatively higher share of residents identifying as Black or African American and/or Hispanic than most other Boston neighborhoods.
After-action reports typically list one or more “incident types” indicating the reason(s) for the raid. In order of frequency, the most common types were Search Warrant – Other/Unknown, Search Warrant – Drugs, Mental Health Crisis, and Barricaded Suspect.
Like other SWAT teams, the BPD SWAT unit is deployed in response to active crises and in deliberate, planned SWAT raids. Typically, the latter cases involve the serving of search and arrest warrants. While the BPD has discretion about whether to deploy the SWAT unit in response to calls for service, SWAT deployments pertaining to active emergencies like mental health crises, barricaded suspects, and domestic violence incidents are nonetheless responsive to active emergencies in the community. On the other hand, the deployment of the SWAT unit to serve warrants, particularly search warrants, is more reflective of self-directed police work. For that reason, racial disparities in the use of SWAT units to serve search warrants are a significant cause for concern.
Data indicate that white and Black people in the United States use and sell drugs at approximately the same rates. But the BPD’s SWAT unit serves drug warrants almost exclusively on people of color.
The data: Targets of the BPD's SWAT raids
According to the after-action reports, 784 people were subjected to SWAT raids between 2012 and 2020. 270 of these individuals were specifically marked as the “suspects” or “targets” of the raid.
The ages of all raid subjects ranged widely from infants to 83-year-olds. Individuals between 20 and 40 years old were the largest group impacted. For those marked specifically as raid suspects or targets there is a smaller range of ages; the youngest person was 16 and the oldest was 67.
According to the reports, 105 children under the age of 18, including 25 children under the age of 5, lived in homes subjected to BPD SWAT raids between 2012 and early-2020.
Those impacted by raids were predominantly men, accounting for 88% of those targeted by raids and 62% of all individuals subjected to raids. When considering both race and gender, Black men were the largest group of those both subjected to raids (38%) and marked as raid suspects/targets (50%).
There are significant racial disparities in those targeted and all those impacted by raids — 56.3% of those targeted by raids were Black non-Hispanic and 8.5% were Black Hispanic. These figures are disproportionate to the share of Black residents in Boston. As of the 2020 Census, 25.5% of Boston’s population was Black or African American; this figure includes multiracial residents and both Hispanic and non-Hispanic residents. Of this, 22% of Boston’s population was Black non-Hispanic, and 3.4% was Black Hispanic. Hispanic residents are also disproportionately impacted by raids. 28.7% of those targeted by raids were recorded as Hispanic, White Hispanic, or Black Hispanic; however, the 2020 Census found that Hispanic or Latino residents made just 19% of Boston’s population.
The disproportionate share of Black and Hispanic individuals impacted by raids varies by incident type; the disparity is notable in “officer-initiated” raids* such as those for search warrants. In contrast, the demographics of people subjected to SWAT team involvement in crisis-related incidents, such as mental health crises, more closely reflect the demographics of Boston.
*To better understand BPD SWAT unit practices, we categorized incident types into “officer-initiated” incidents such as search warrants or arrest warrants and “crisis-related” incident types that reflect an emergency such as a mental health crisis.
Another way to view this disparity is to look at the share of white non-Hispanic residents impacted by raids. White non-Hispanic people are underrepresented in officer-initiated raids; Boston’s population is 44.6% white non-Hispanic, but the group of people impacted by all officer-initiated raids are only 6.5% white. In contrast, white people were involved in crisis-related raids at a rate more proportionate to the overall population; 33.5% of those impacted by these raids are white.
The data: SWAT team after-action reports document frightening, militarized surprise raids
Reports detail the SWAT team battering down doors, deploying aerosol grenades, waking individuals asleep in bed, and detaining relatives of suspects and children. According to the reports, well over half of the people subjected to this level of force were not even the targets of the operation but were just roommates, partners, family members, or children who were present in the home during the raid.
SWAT raids can even harm people who live nearby a person wanted by police. One of the records details a raid where the entire household was not the target of the operation; the SWAT team failed to go to the correct address on a search warrant and wrongfully invaded another family’s home. In 2018, the ACLU of Massachusetts represented this family in a lawsuit against the BPD. As our lawsuit on behalf of the family alleged, “[the BPD SWAT team] used a battering ram to break down the door, trained guns on and handcuffed the parents ... and their 15-year-old child, and ransacked the home with two younger children present.” The family suffered lasting emotional distress from this assault. Ultimately, the case was settled and the City was forced to pay the family $500,000.
If you are interested in learning more about the practices of the BPD SWAT team, please use the interactive BPD SWAT records review tool. In addition to exploring the data, you can also read the original after-action reports, which include a narrative description of the incident at the end of each document. Please don’t hesitate to contact data4justice@aclum.org with any significant findings.
Review Boston Police SWAT After-Action Reports
Data Notes and Methodology
The original incident reports were made public as non-machine-readable PDFs. Therefore, the first task of this project involved determining how to extract information from these files in a usable format. Volunteer data scientists began by OCR-ing and processing the PDF files to extract useful fields from the documents. Due to the nature of the PDFs and occasional image quality issues, the programmatic data processing and extraction of these reports was subject to error. As a final measure to address any errors and ensure overall data quality, selected fields were manually reviewed and updated by volunteers. For additional data documentation please see the “data notes” section of the BPD SWAT tool.
This data extraction project was possible with the support of:
- Tarak Shah, Human Rights Data Analysis Group — programmatically extracted data from the after-action report PDFs
- Aaron Boxer, ACLU-MA volunteer — conducted data extraction, processing, manual entry, and analysis
- Natasha Ceol, ACLU-MA volunteer — assisted with data quality-checking and redaction of the after-action reports.
Analyzing Mayor Wu’s FY24 Boston Police Department Budget Recommendation
See our previous work on policing in Massachusetts
On April 12, Mayor Wu submitted her recommended operating budget for the upcoming fiscal year (FY24) to the Boston City Council, kicking off the public portion of the City’s budgeting process. Among other investments, the Mayor’s budget proposes funding the police department at $9.88 million over its FY23 budget.
Over the coming months, the City Council will review the Mayor’s budget recommendation and can propose and vote on changes. During this same review period last year for the FY23 budget, the City Council unanimously proposed reducing funding for the police department and increasing funding for youth engagement and employment programming, among other proposed changes. These efforts had a limited impact in 2023, however. The Mayor’s budget passed with a few small tweaks from the Council.
This analysis focuses on the Boston Police Department’s (BPD) budget. Our hope is that this breakdown will be useful for community members, journalists, and other interested parties as the City’s various stakeholders and residents engage in conversations and debate on the budget, which are set to take place between now and July. To explore the full recommended operating budget and design your own changes, please see our (Co)Design the Boston Budget calculator tool.
The Mayor’s proposal would increase the Police Department budget by $9.88 million
Of the $4.28 billion city operating budget, the Mayor’s recommended budget allocates $404.97 million to the Boston Police Department.
The recommendation is an increase of $9.88 million from last year’s BPD adopted budget of $395.09 million. (Note: the City’s recommended budget document describes this as a smaller $9 million increase for the BPD budget, comparing the Mayor’s FY24 recommendation to the FY23 appropriation of $395.91 million rather than the FY23 adopted budget of $395.09 million. This analysis compares the FY24 recommended budget to the adopted budget of previous years, not the appropriated budgets.)
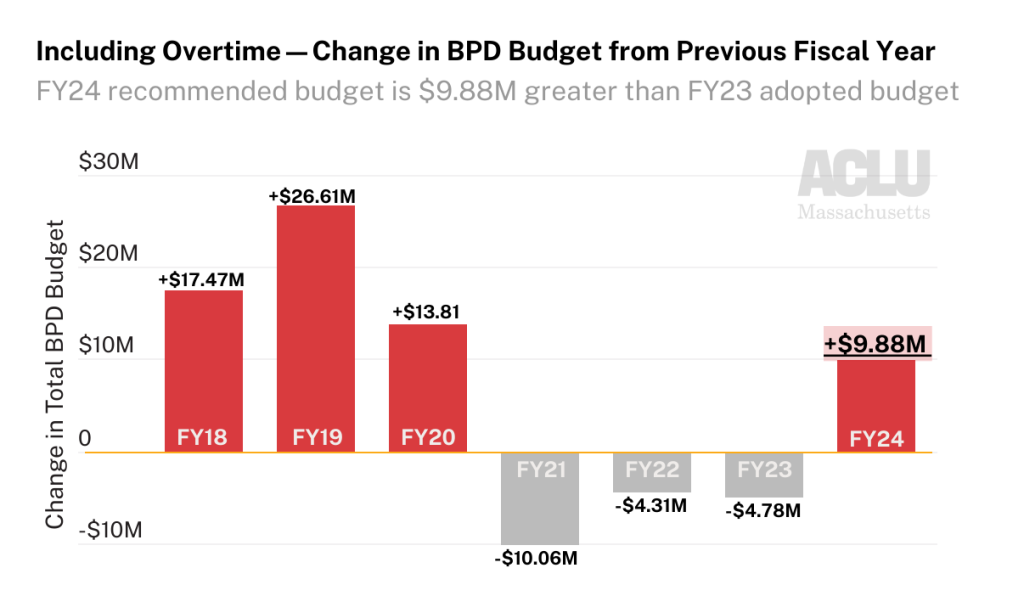
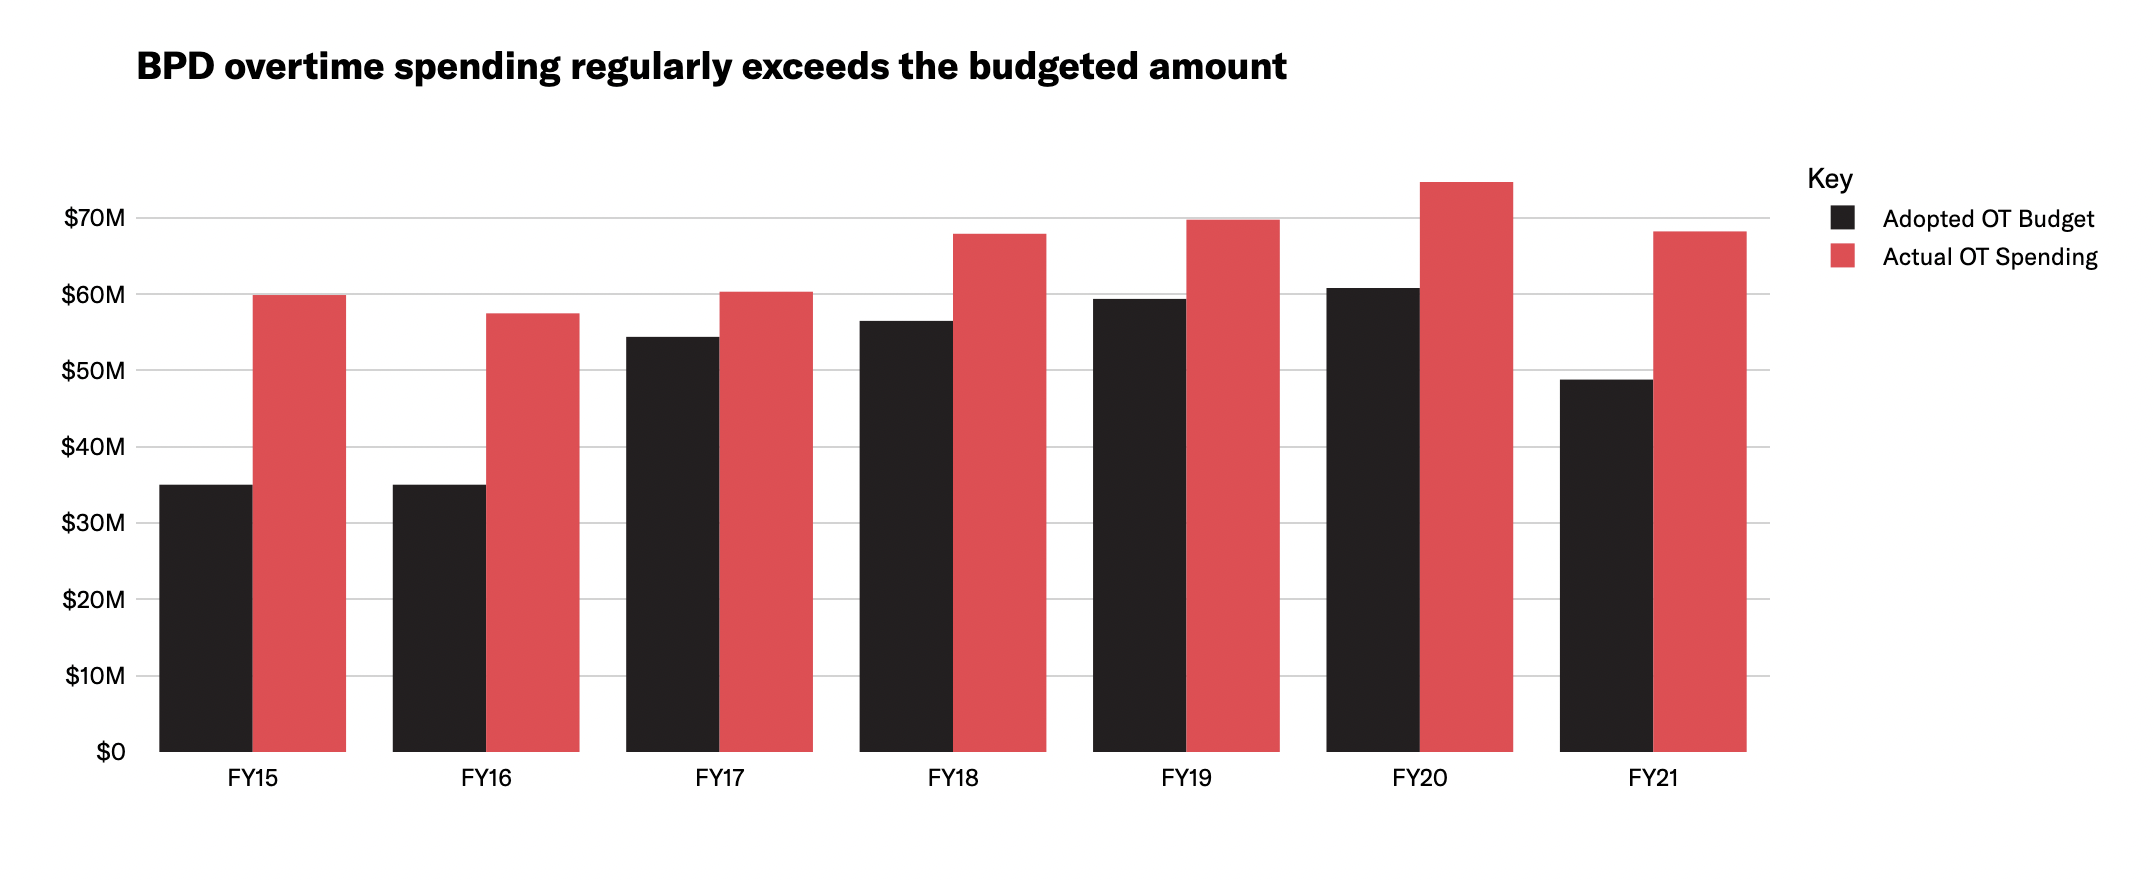
In adopted BPD budgets of recent years, there have been significant reductions to the police overtime line item; notably, this FY24 recommended budget does not make additional changes to police overtime. The FY21 and FY22 budgets both significantly reduced the overtime line item from previous fiscal years, and both the FY23 adopted budget and FY24 recommendation preserve those cuts. However, police overtime spending is not constrained by a reduction in the line-item overtime allocation; all police overtime is paid by the city even when it exceeds its appropriation. Since actual overtime spending frequently surpasses its budget line item, the analysis below compares the Mayor’s FY24 BPD budget recommendation both in its entirety and with the overtime line item excluded.
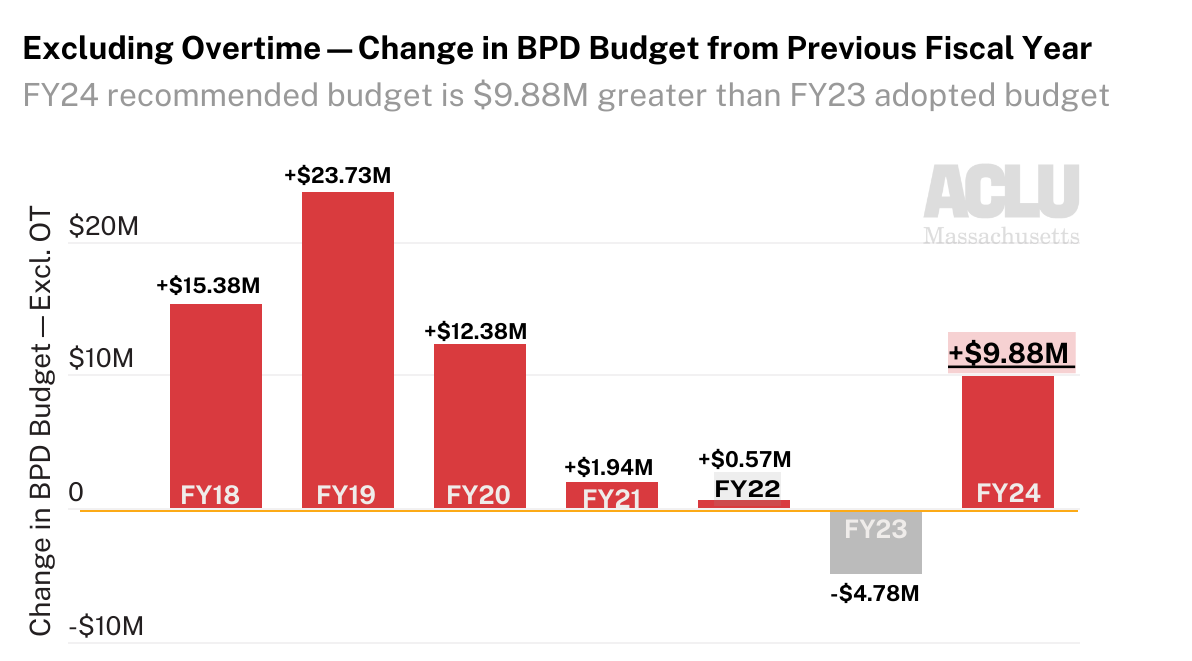
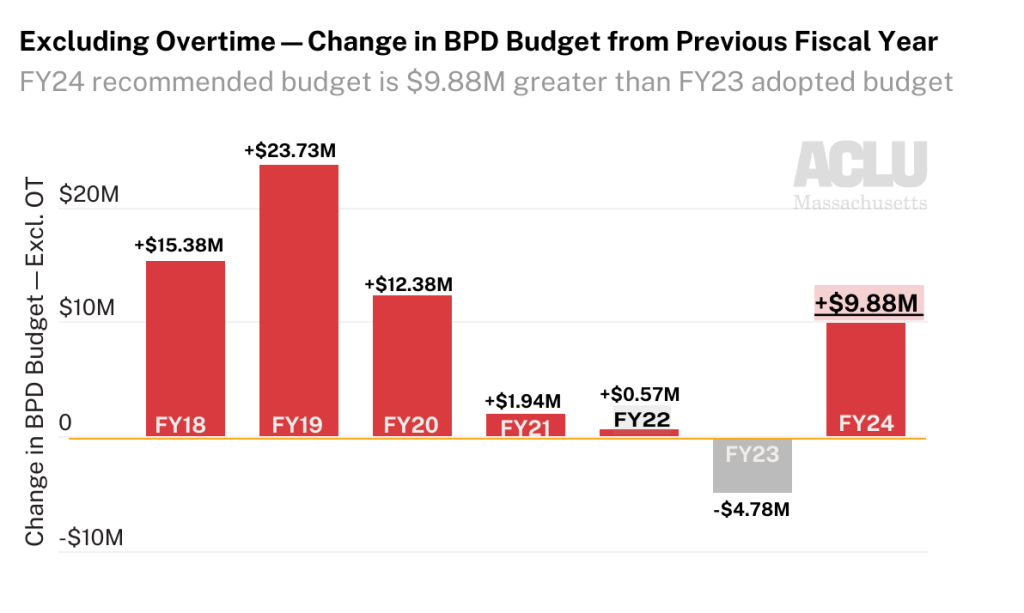
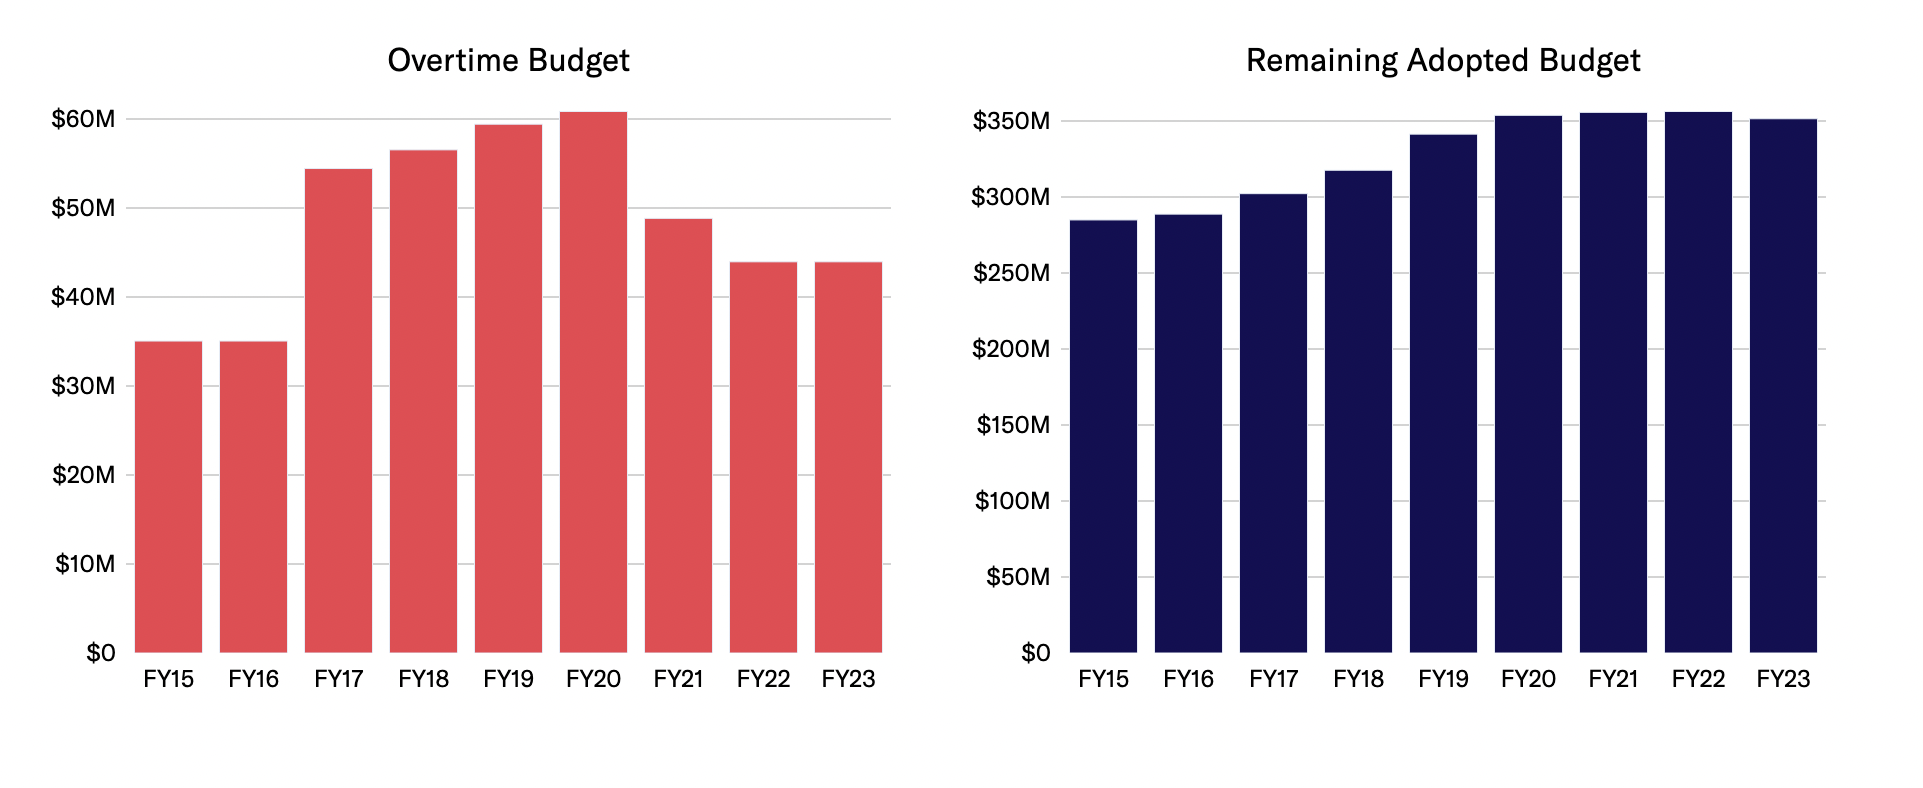
When excluding the overtime budget, the remaining portion of the Mayor’s recommended FY24 BPD budget is the largest in recent years.
The proposed increase in the FY24 police budget represents a shift. In the past few years since 2020, the growth of BPD’s adopted budget has curbed in response to community calls to shift funds from policing into community health and safety initiatives. When excluding the overtime line item, the $12.38 million increase between FY19-FY20 was followed by much lower increases of $1.94 million between FY20-FY21 and $0.57 million between FY21-FY22. Last year’s FY23 adopted budget, also proposed by Mayor Wu, showed a reduction of $4.78 million from the FY22 budget—the first such reduction to non-overtime sections of the budget since at least FY15. An increase of $9.88 million for FY24 would break from the trend of the past few years.
Where is this additional money going?
The bulk of the Mayor’s proposed budget increase for BPD provides funding for police department staff. According to the City’s budget documents, the FY24 recommended budget would fund “a recruit class to replace project attrition” and $582,000 to the Youth Connect program, which provides social workers for police precincts. Last year’s FY23 budget also increased the size of the police cadet class from 60 to 90; it appears that this budget preserves that increase.
Here’s how the BPD’s staffing levels under the FY24 recommendation would compare to other city departments, excluding the Boston Public Schools.
The Mayor’s budget recommendation proposes 2,766 full-time equivalent employees (FTE) at BPD on 1/1/24. This represents:
-
- 3.3x the FTEs of the Public Health Commission
- 7x the FTEs of the Public Library
- 10.3x the FTEs of the Boston Center for Youth & Families
- 11.8x the FTEs of Parks and Recreation
This is an increase of 108.6 full-time equivalent employees compared to 1/1/23, though as city documents note, it is important to bear in mind that the number of employees on January 1 of a given year often varies due to retirement timing and the start of new classes. Budget documents describe this change in staff levels along these lines—as a reflection of last year’s police class being delayed until April 2023.
The size of BPD’s full-time equivalent staff exceeds not just departments but entire city cabinets. The police department is larger than every cabinet besides Education and its own Public Safety cabinet.
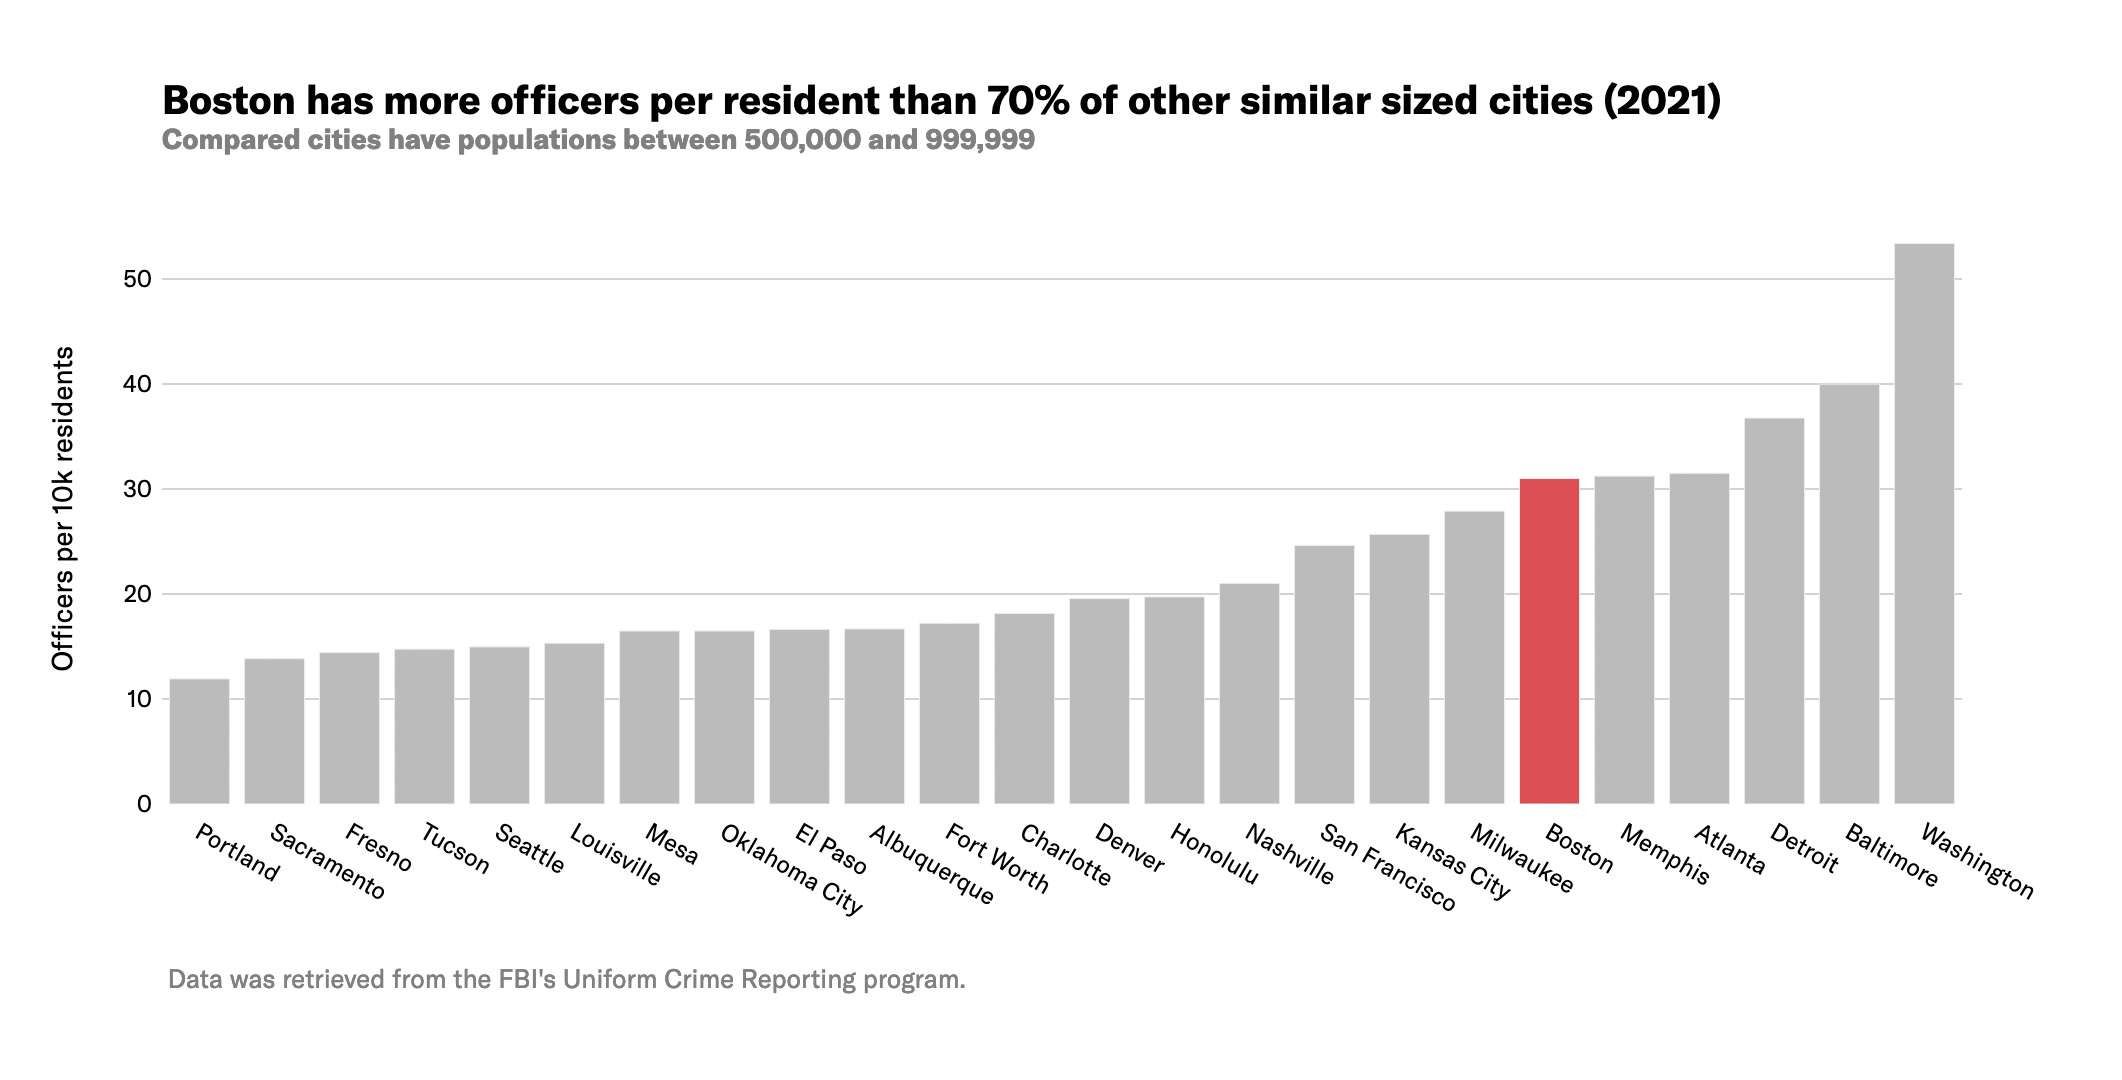
Boston has typically had higher-than-average police staffing. As we previously demonstrated using FBI UCR data, in 2021 Boston had more officers per resident than 70 percent of similarly sized cities.
BPD has a higher budget than every city department other than Boston Public Schools
Year after year, the Boston Police Department has the second-largest budget of any department, second only to the Boston Public Schools.
Note: The chart above excludes Boston Public Schools, which has a FY24 recommended budget of $1.45 billion.
Just as the size of the police department staff surpasses nearly all other departments and cabinets, so does the size of its budget. Per the Mayor’s recommended FY24 budget, the BPD budget would be:
-
- 3.2x the size of the Public Health Commission
- 8.5x the size of the Library Department
- 9.9x the size the Environment, Energy, & Open Space Cabinet
- 13.5x the size of the Boston Center for Youth & Families
- 22.5x the size of Youth Employment and Opportunity
Boston Police Department overtime spending
The police department’s funds extend beyond the already-sizable adopted budget; the City pays all overtime costs that the police department incurs even when they exceed the initial budgeted amount. And as we’ve documented the police also receive large amounts of grant funding from the state and federal governments each year.
The department continually exceeds its overtime appropriation. Last year’s overage was particularly substantial, since the FY22 police overtime budget was reduced on paper but actual police expenditures did not decline accordingly. The department spent $72.33M on overtime: similar to previous years’ overtime spending but $28.41M more than budgeted.
To put this overage in perspective, the difference between BPD’s budgeted overtime allocation and its actual overtime spending in one year could fund not just departments but entire City cabinets. $28.41M is enough to cover the FY22 expenditures for the Cabinets of Equity and Inclusion ($9.8M), Economic Opportunity and Inclusion ($7.6M), Community Engagement ($4.22M), Arts and Culture ($3.50M), and Office of Police Transparency and Accountability ($718K) combined, with a couple million to spare. This FY22 overage is also over half of the Boston Public Library’s budget.
For more on BPD payroll and overtime during the 2022 calendar year, please see our previous analysis.
Data Sources
- Boston’s open data portal
- Boston’s City budget website
-
- Current and past fiscal year budgets at bottom of page; information was obtained from the “operating budget” and “public safety cabinet” sections of the budget documents
Explore the FY24 budget recommendation
- FY24 recommended budget document (at bottom of page) and dataset
- (Co)Design the Boston Budget—budget calculator tool helping you design your own operating budget, using the FY24 recommendation as a starting point
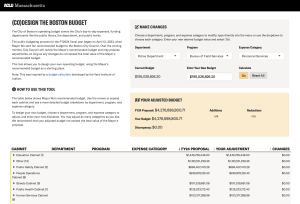
(Co)Design the Boston Budget – Budget Calculator
How to get involved
- Members of the public may testify at City Council hearings on the budget, which started this week and will continue through early June. Public testimony, including virtual public testimony, will be accepted at each hearing and at the public testimony hearings.
-
- Resources
-
-
- City Council Budget website – full hearing schedule towards bottom of page
- Public Notice – updated dates and times of hearings
- Boston City Council TV – hearing livestreams
- Guidance on testifying at a budget hearing
-
-
- Schedule for BPD budget hearings, public testimony, and working sessions as of 5/5/23. These are subject to change—confirm hearing dates and times through Public Notice. Both the Ianella Chamber and Piemonte Room are on the Fifth Floor of Boston City Hall:
-
-
- Thursday, May 11 at 10am (Iannella Chamber) – Hearing: BPD Revolving Funds
-
-
-
- Thursday, May 11 at 2pm (Iannella Chamber) – Hearing: Grants, Reform, Community Programs, and Crisis Response
-
-
-
- Thursday, May 17 at 6pm (Iannella Chamber) – Public Testimony: BPD, BFD, Safety, BEMS
-
-
-
- Tuesday, May 30 at 2pm (Piemonte Room) – Amendments Working Session: BFD, BPD
-
The analysis benefitted from feedback and input from Fatema Ahmad (MJL), Lauren Chambers (UC Berkeley I School; ACLUM), and Youth Justice and Power Union. Data analysis was informed by work done in collaboration with Boston University students under the supervision of the BU Spark! Program.
Looking Back at the FY2023 Boston Police Department Budget
See our previous work on policing in Massachusetts
Mass nationwide mobilization in 2020 against policing violence and the anti-Black criminal legal system intensified calls for government action against police abuse. Among many other things, this organizing brought heightened public attention to municipal police budgets. In Boston, groups including Muslim Justice League, Families for Justice as Healing, Youth Justice and Power Union, Asian American Resource Workshop, Boston Cyclists Union, The City School, and Boston Liberation Health have in recent years called on the City Council and Mayor to shift funds from the Boston Police Department into community safety and wellness programs.
The City of Boston is soon approaching budget season for the upcoming fiscal year; the Mayor’s proposed FY2024 budget is expected to be filed by April 12. To help inform the forthcoming conversations around the proposed budget for next year, Boston University’s Spark! Lab and the ACLU of Massachusetts analyzed the FY2023 (2022-2023) budget for the Boston Police Department.
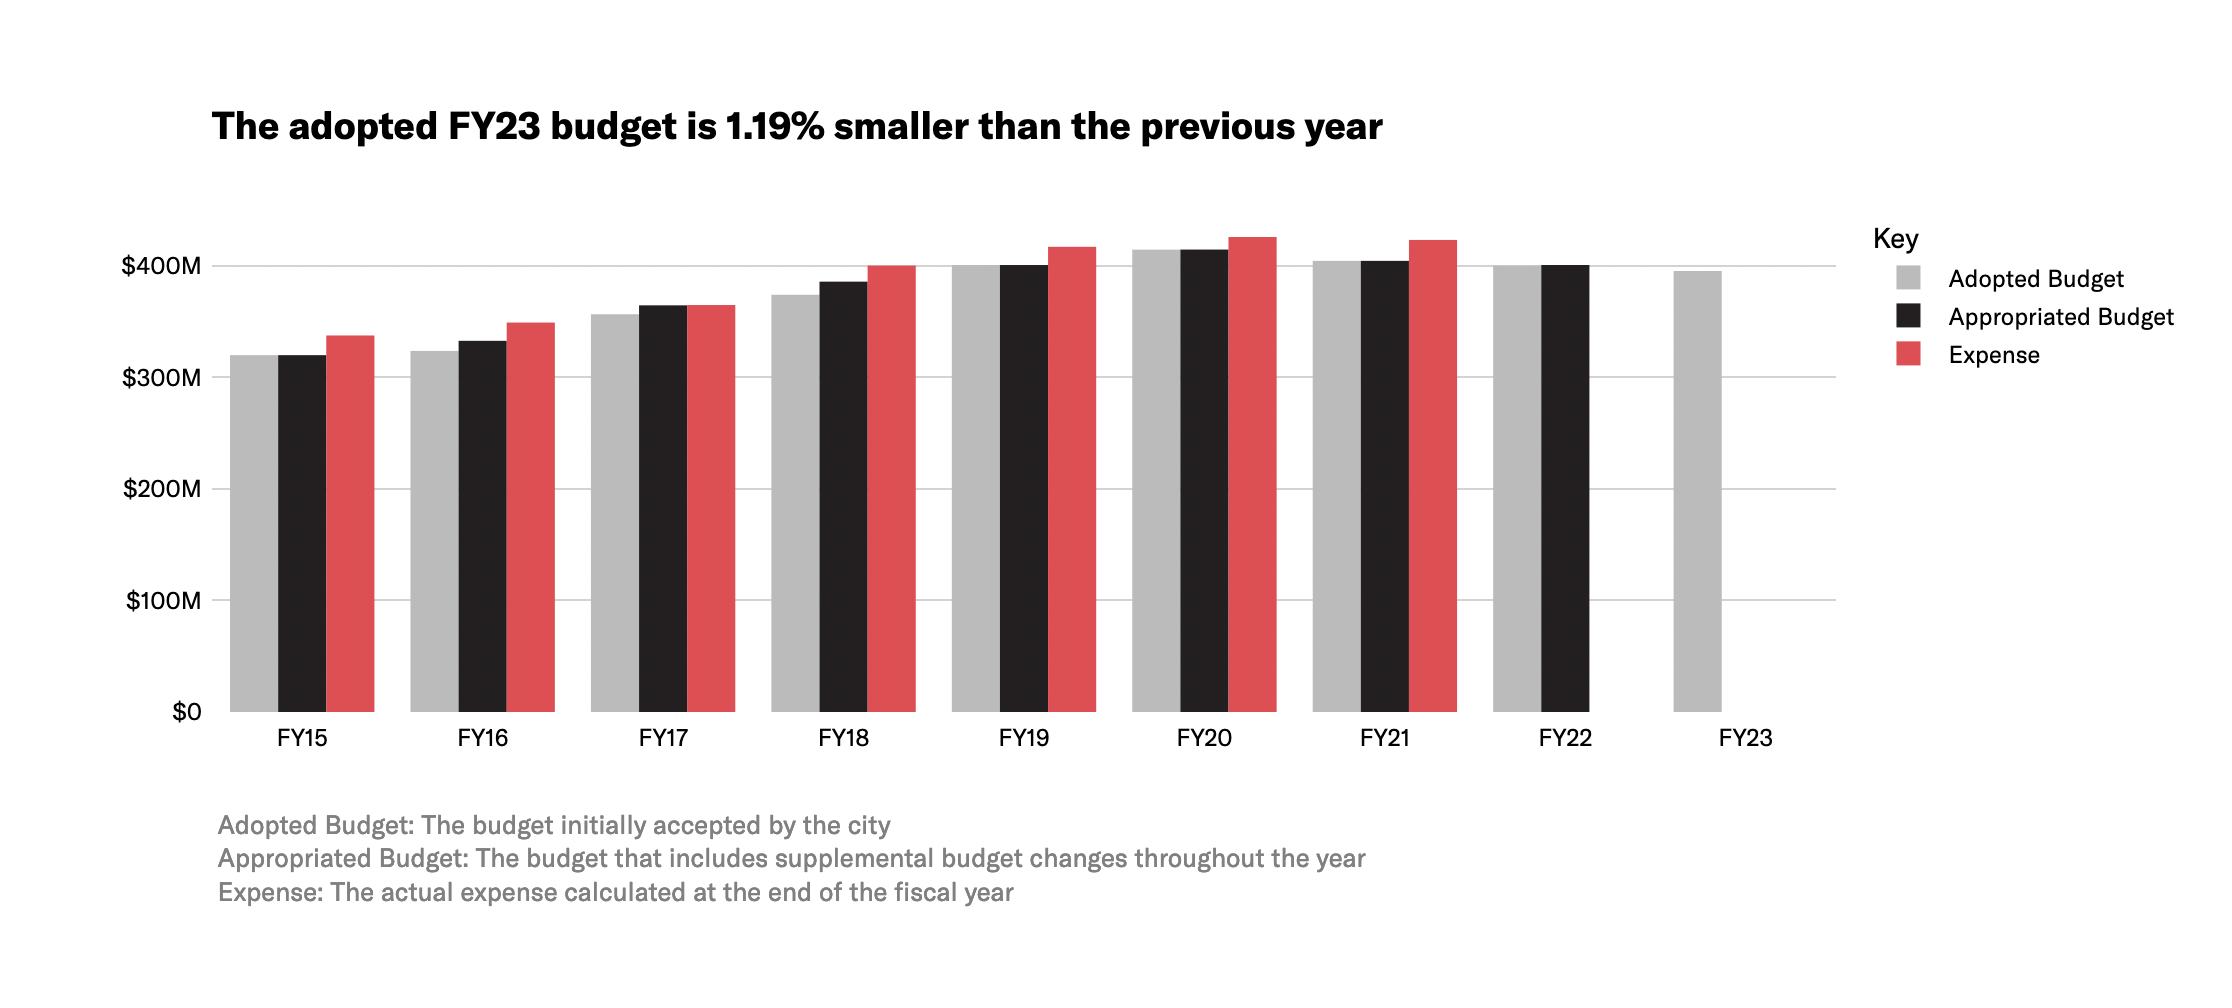
This analysis shows that the adopted FY2023 police budget, which is 1.19% smaller than in FY2022, is similar to previous years.
The FY2023 Boston Police Department budget is slightly smaller than previous years
The total FY2023 City of Boston operating budget is $3.99 billion. Of this, the Boston Police Department (BPD) is budgeted $395 million.
The FY2023 BPD budget is 1.19% smaller than the department’s near-$400 million FY2022 budget.
According to the City, these budget reductions primarily result from a lower budget for salaries because younger officers are replacing older officers. In addition, the Mayor postponed an academy class by one month, saving the city $1 million.
However, the number of police officers in the budget increased in the FY2023 budget, as did the number of 18-25 year olds in a cadet program designed to train people who will apply to become police officers in the future. In addition, contract negotiations are underway with the police associations. If the city agrees to retroactive pay increases, then the existing contracts would retroactively increase the FY2021, FY2022, and FY2023 budgets and potentially reverse reductions in those budgets.
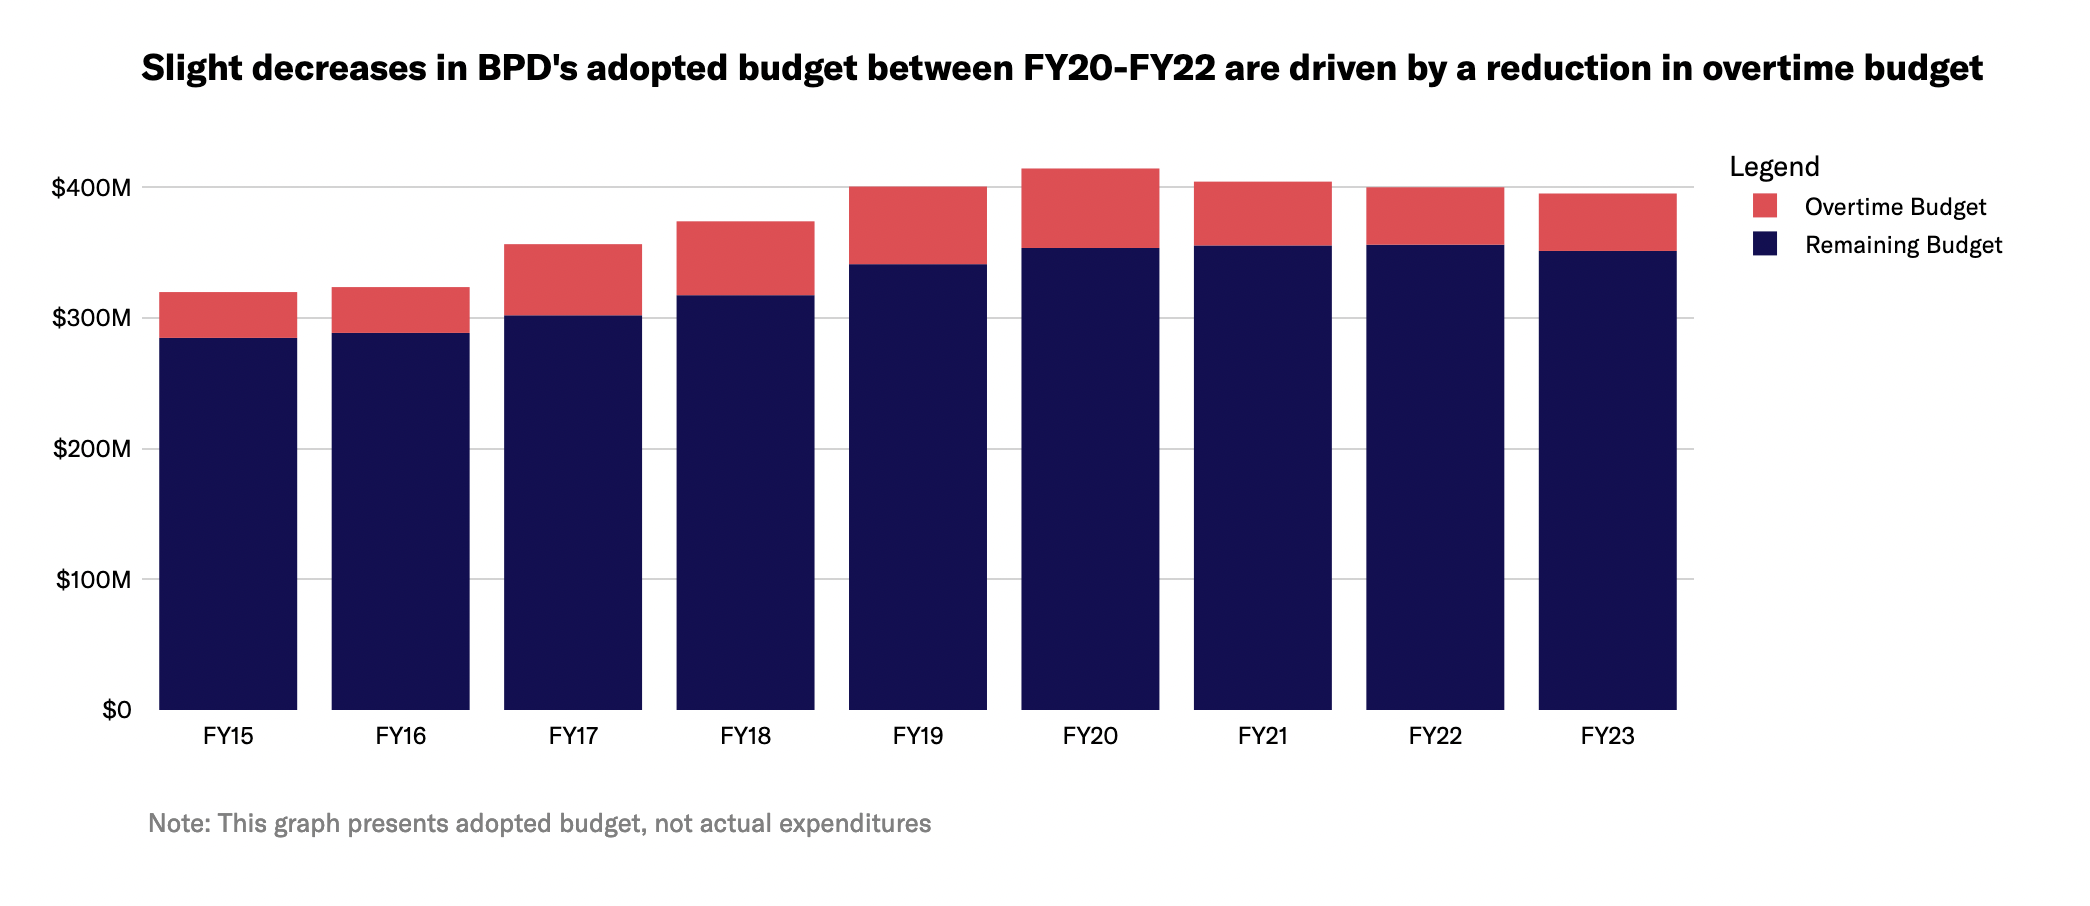
Unlike the past few years, the FY2023 BPD budget reduction was not due to a reduction in the overtime line item
Looking back at previous years, the slight reduction in the adopted Police Department budget between FY2020 and FY2022 can be attributed to reductions in budgeted police overtime. Reductions in the overtime budget outweighed increases in other areas and contributed to a small overall decline in the total size of the department budget.
However, these reductions in the overtime budget have a limited impact on decreasing police spending, because the City is required to pay whatever overtime is incurred regardless of what is budgeted. In fact, actual overtime expenditures regularly exceed the budgeted amount, including in FY2020, FY2021, and FY2022. While the overtime budget decreased from FY2020-FY2021 and FY2021-FY2022 by $12 million and $4.88 million, respectively, actual overtime spending decreased by $6.48 million and (based on City estimates in May 2022) $1.4 million, respectively. Real overtime cuts will require both contract reforms as well as overhauling BPD’s practices around overtime.
This FY2023 budget reduction is notable in that the $4.78 million decrease in the BPD budget is not due to a decrease in the overtime line item.
When disregarding the overtime line item, the remaining BPD budget has been stable in recent years. It increased slightly from FY2020 to FY2022 and decreased slightly in FY2023. FY2023 is the first year since at least FY2015 that the non-overtime sections of the BPD budget decreased.
The Boston Police Department budget is the second-largest line item in the entire budget, second only to Boston Public Schools
The Boston Police Department’s $395 million budget makes up nearly 10% of the entire City of Boston operating budget. In comparison with other City departments, it is:
- 13.84 times the size of the Parks Department
- 9.13 times the size of the Library Department
- 3.35 times the size of the Public Health Commission
- 1.43 times the size of the Fire Department
The City pays more for policing than what is reflected in the operating budget
Yet the amount allocated to the police in the operating budget is not the full picture of BPD’s funds. City employee benefits, overtime, and external funding all contribute to department resources:
- As detailed by Citizens for Juvenile Justice’s Hidden Costs of Policing report, the City pays separately towards pension and health insurance for police department staff. Although these costs fall outside the operating budget and are not reflected in this analysis, they are a significant part of the full cost of operating the Boston Police Department. The Hidden Costs of Policing report shows that this expense was over $168 million in FY2021.
- With police overtime overages, the City regularly pays more to BPD than the adopted budget amount. In FY2021, over $68.2 million of overtime was incurred, which was $19.4 million more than what was budgeted. Due to the City’s interpretation of an exception in the Boston charter, the amount spent on police overtime—even if it exceeds the budget—is always paid out. For more on this exception, please see our April 2021 analysis.
- The Boston Police Department also gets funding from external sources. As noted in a previous D4J analysis, BPD gets additional money through the separate Office of Emergency Management and other state and federal grants.
Thus, the full operational costs of the Boston Police Department are even greater than the already-extensive operating budget (and greater than what is reflected in this analysis here).
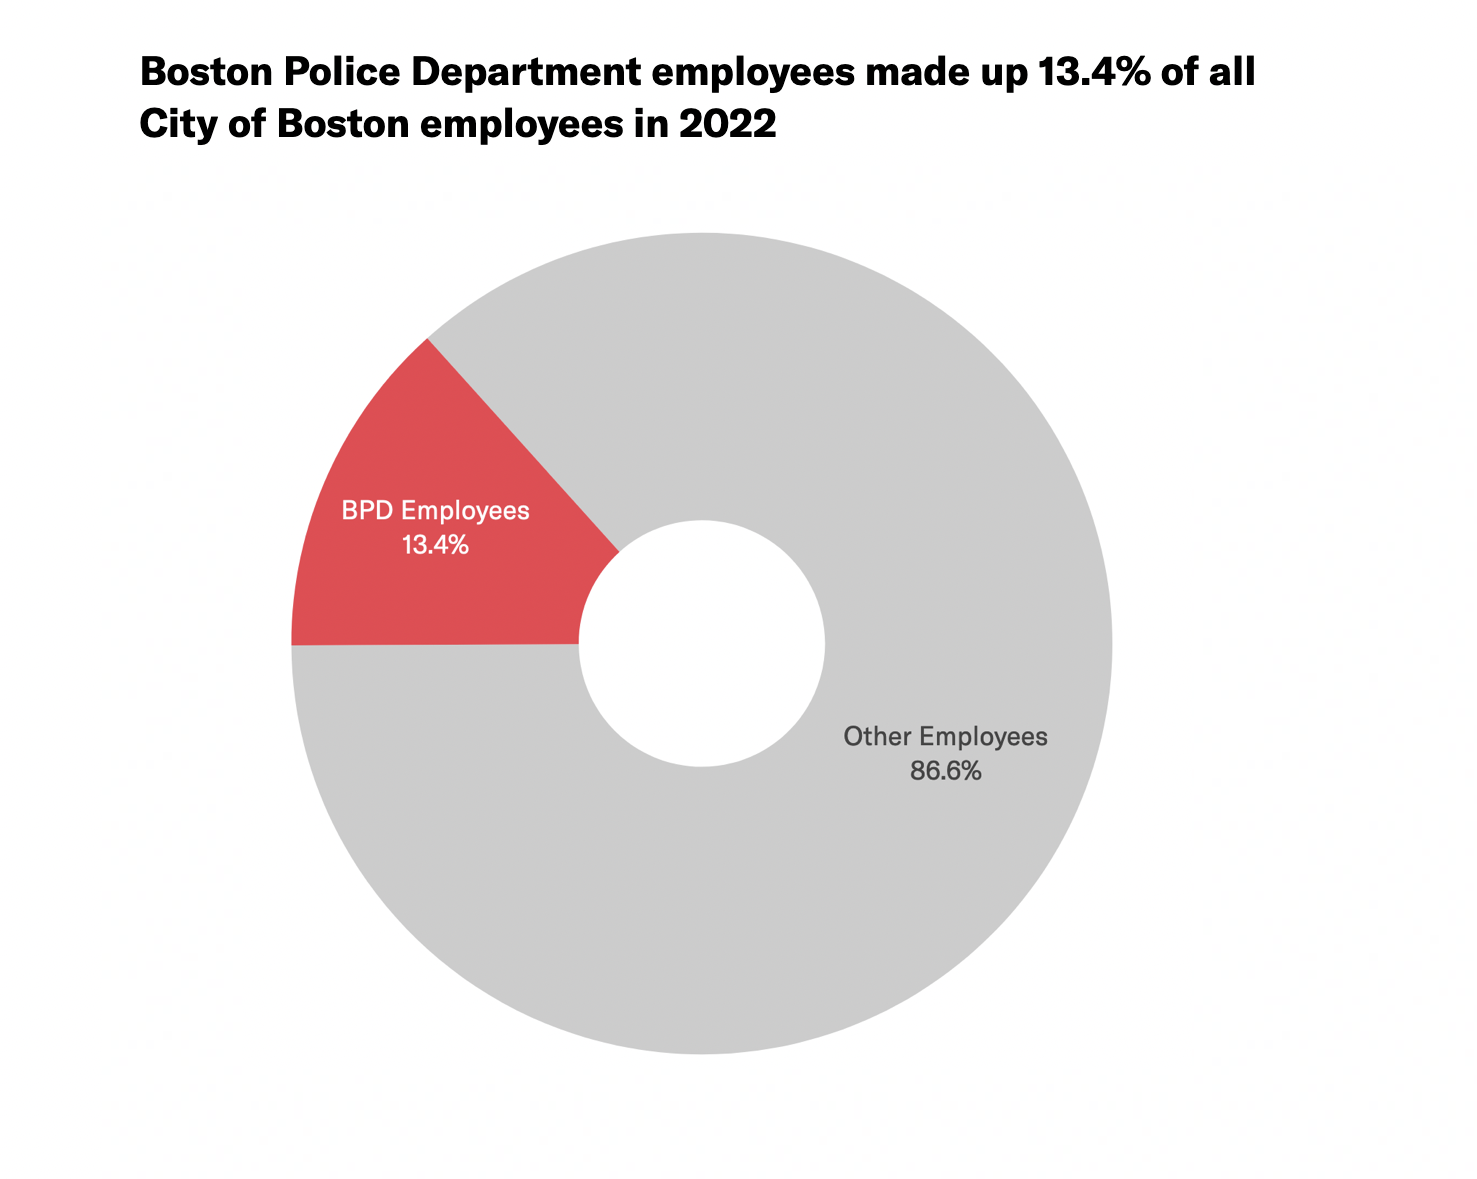
In 2022, 1 in 5 of the City’s payroll dollars went to BPD
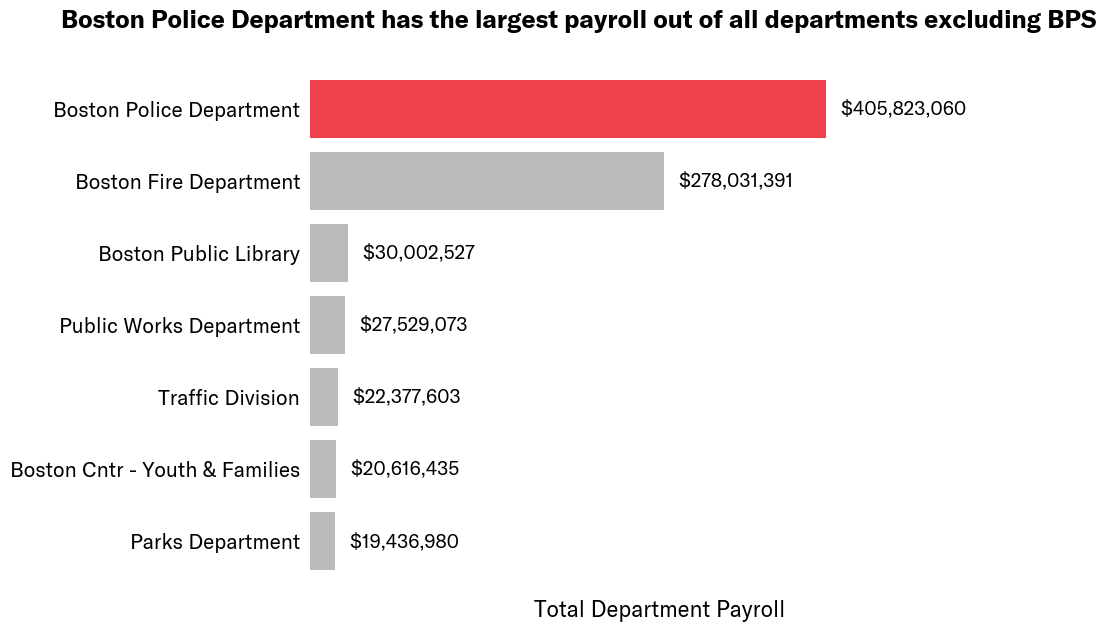
The Boston Police Department’s payroll totaled $405 million in the 2022 calendar year, according to the City’s employee earnings report.
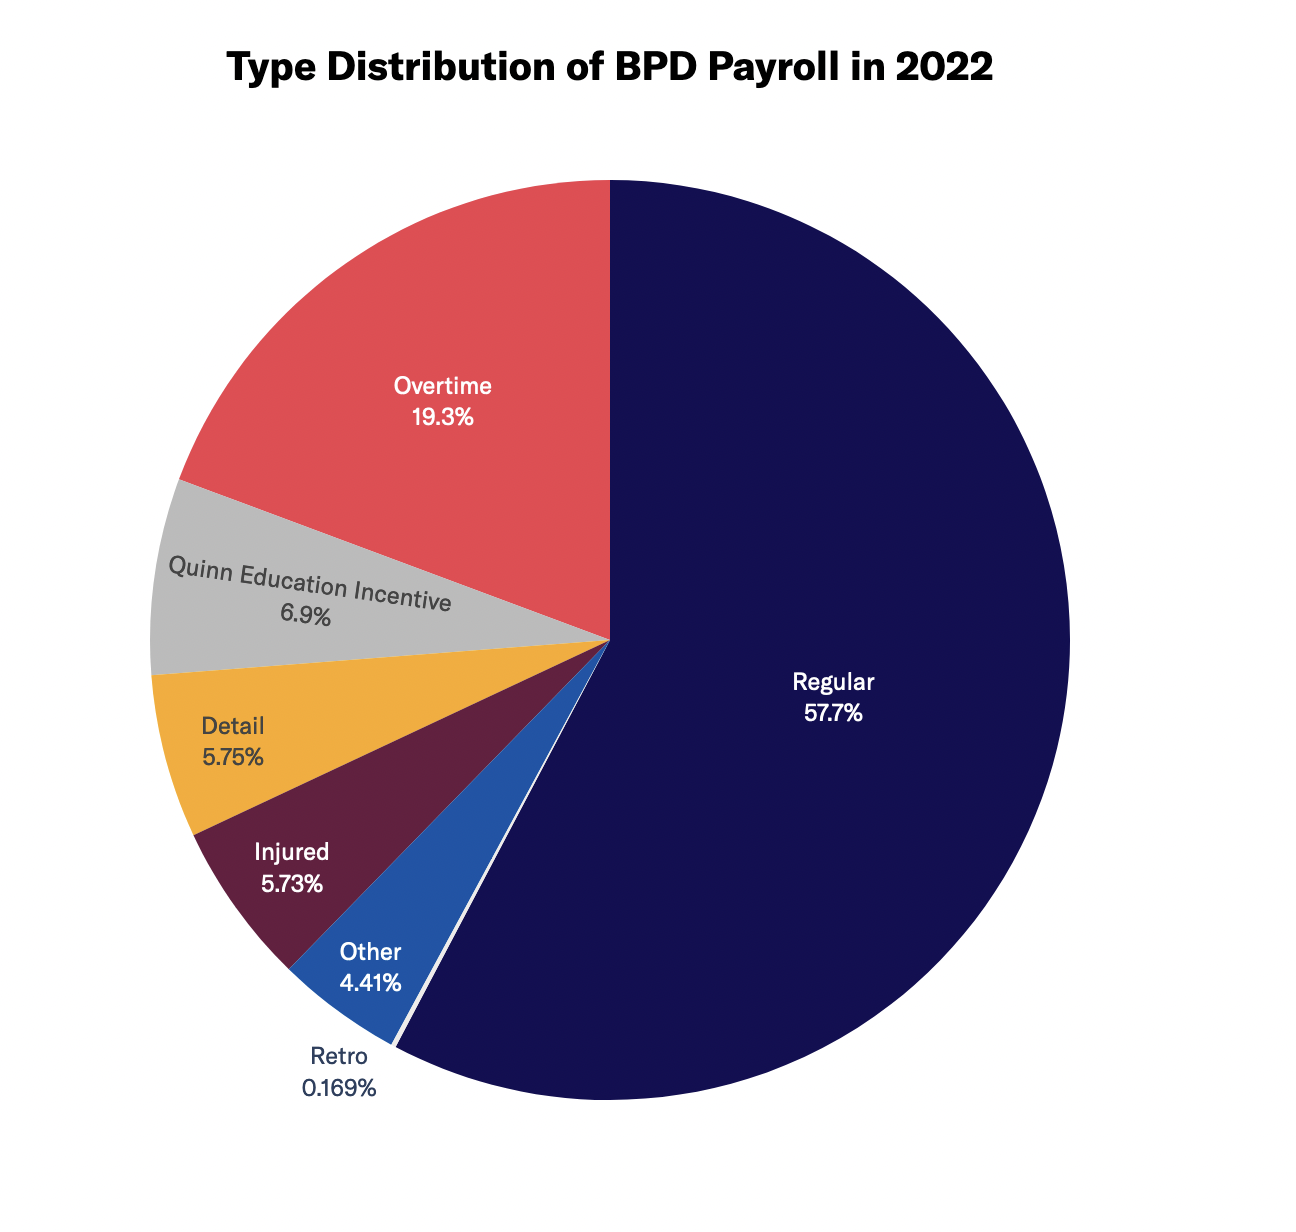
This figure includes more than just base salary and overtime. The earnings report shows payroll earnings from all the following categories: paid detail, injured, overtime, education incentive, regular, retro, and other (including from bonus incentives, grievance/settlements, stipends, and reimbursements).
To put this $405 million figure in perspective, the size of the Police Department payroll was:
- 20.88 times the size of Parks Department
- 13.53 times the size of the Public Library
- 1.46 times the size of the Fire Department
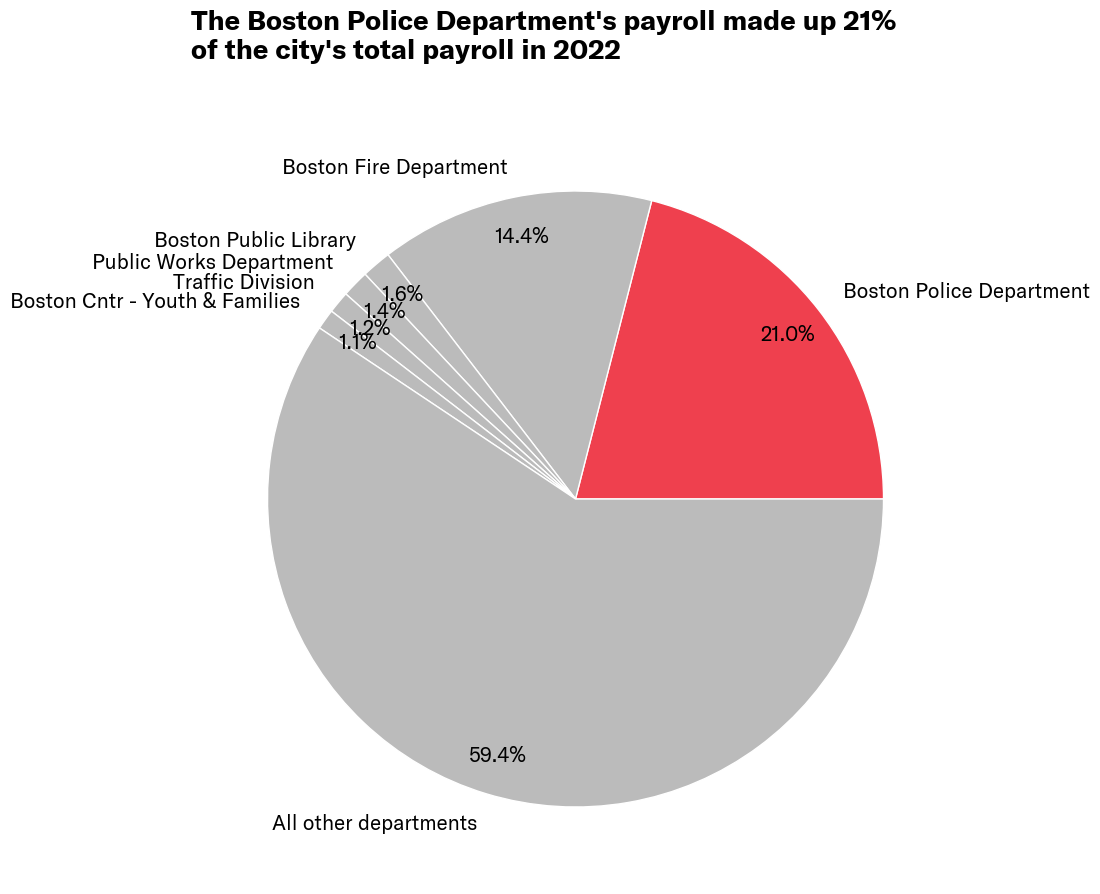
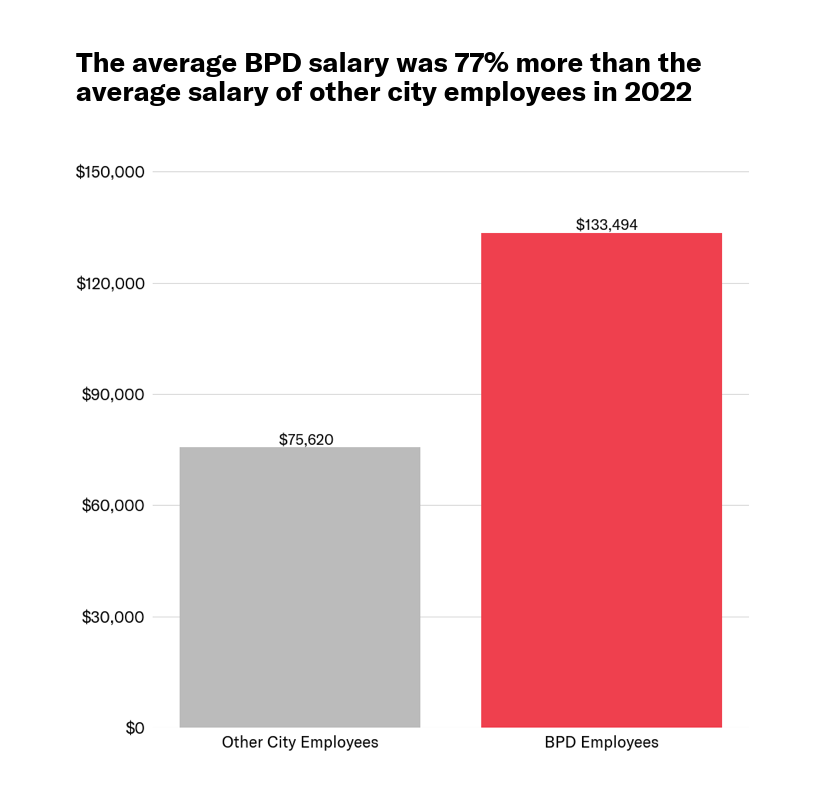
High payroll costs stemmed from both the large size of the department and the higher-than-average pay of employees—Boston Police Department employees made up 13% of the City’s total employees but department payroll made up 21% of the City’s total payroll.
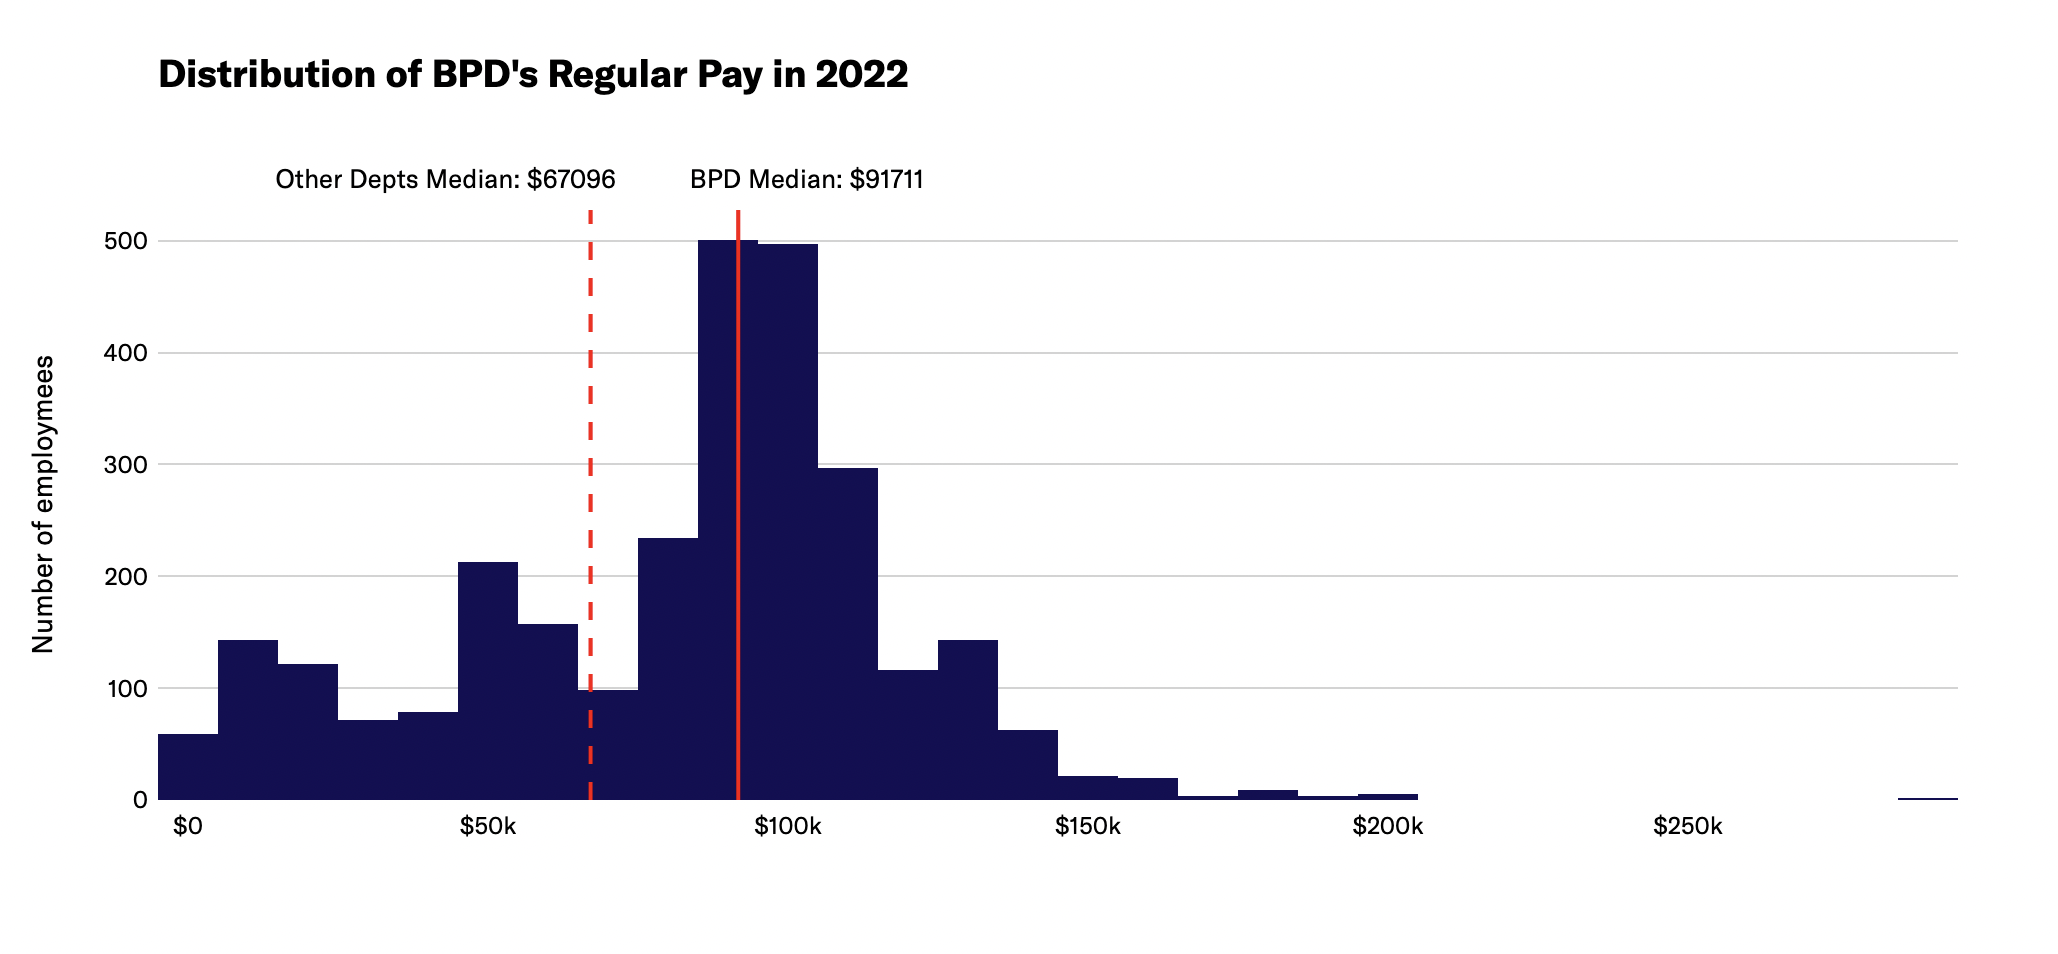
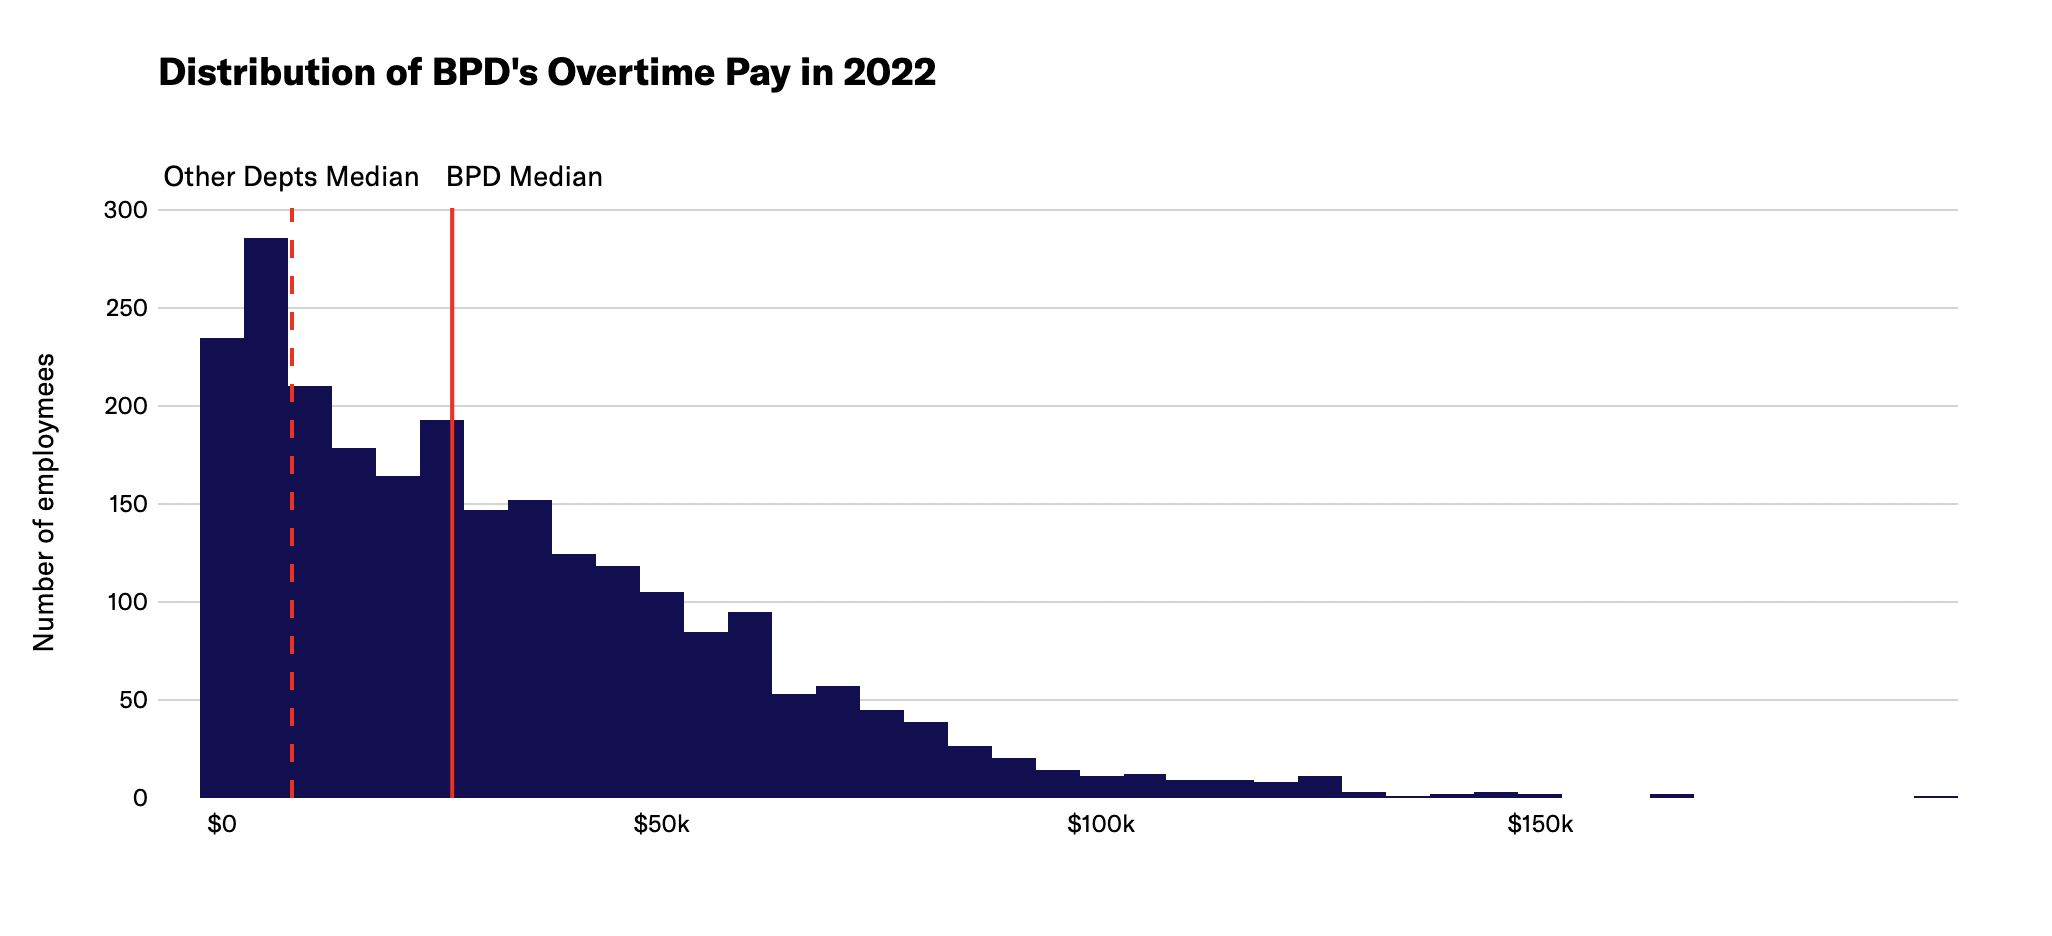
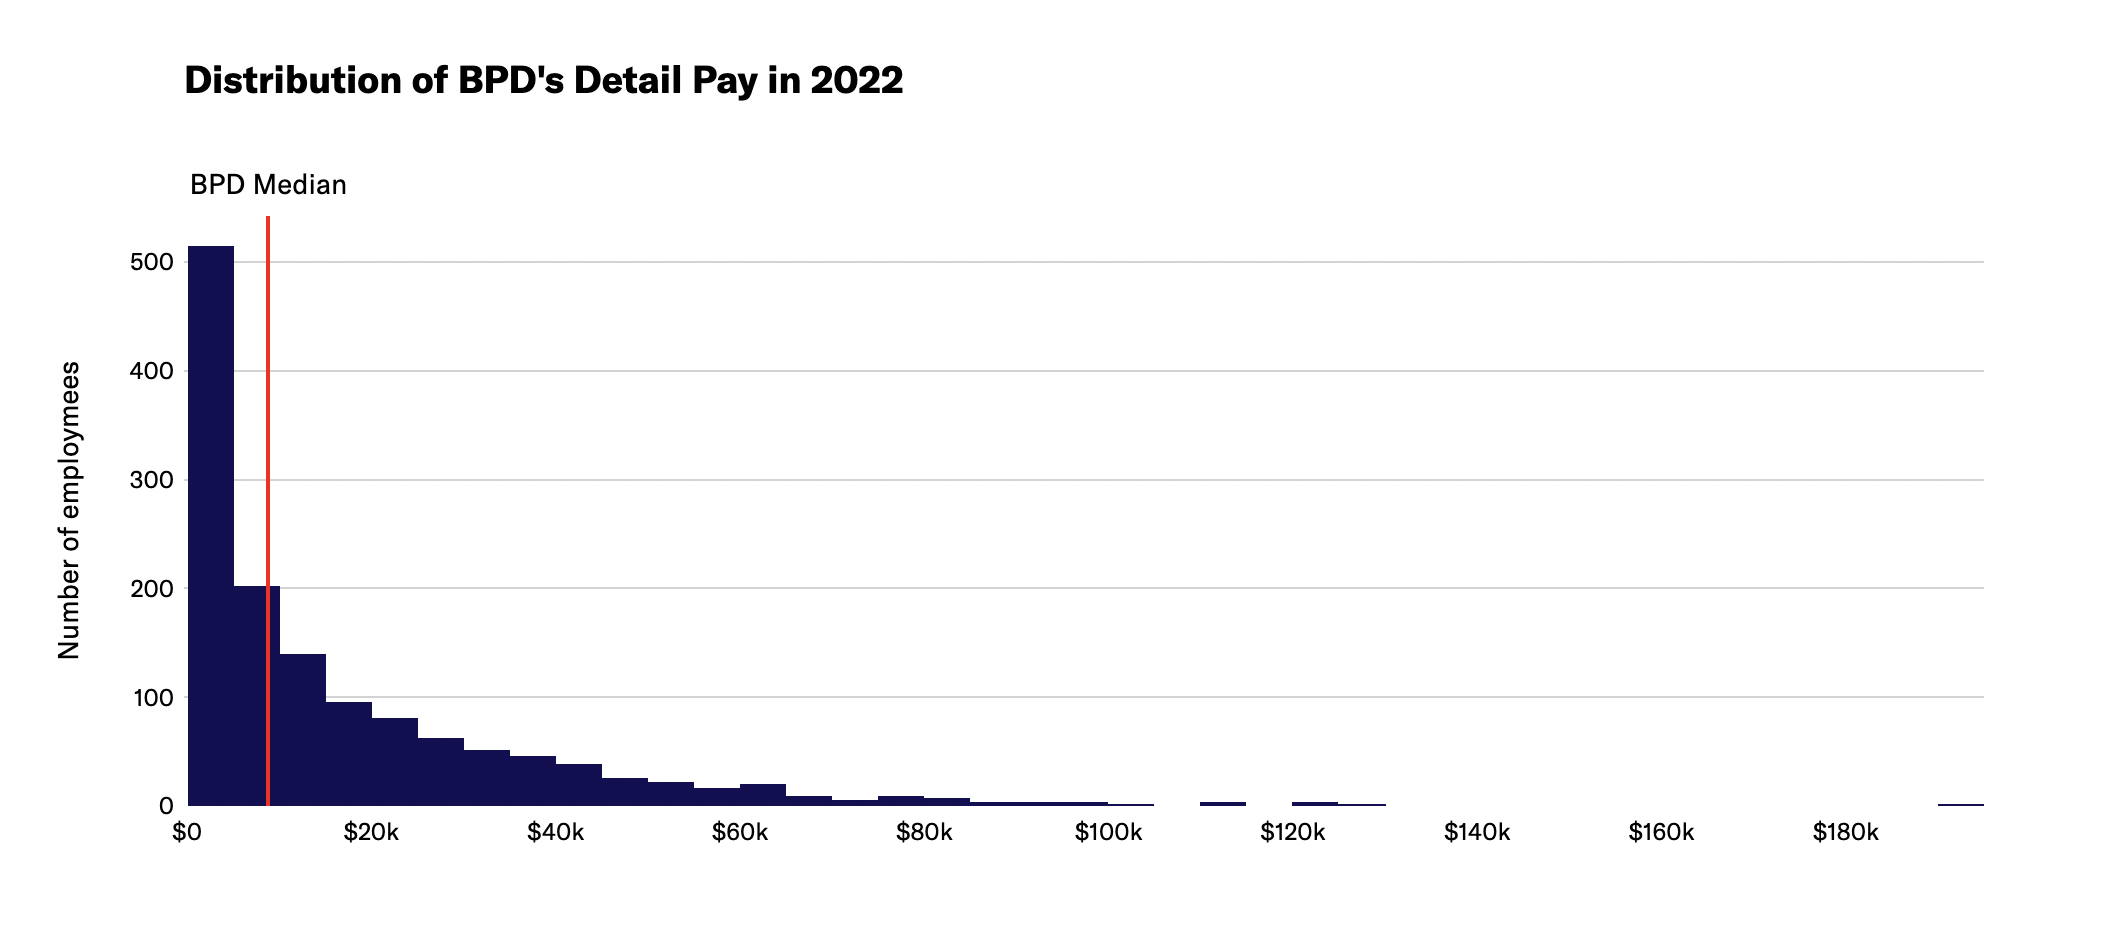
See below for distribution of department regular, overtime, and detail pay in 2022.
Police Department overtime expenditures regularly exceed the budgeted amount and fuel high payroll costs
BPD has exceeded their overtime budget in previous years. As of the May 2022 City Council hearing on the BPD budget, the department had already surpassed their FY2022 overtime budget by $10 million. At that time, it was anticipated that by the end of the fiscal year, overtime expenditures would be $66.8 million, $22.9 million over the $43.9 million budgeted for overtime spending. The City finds money to fund this police overspending every year—a privilege that is generally not afforded to other city departments.
Overtime spending and overspending does not occur by accident. In a December 2015 report, an audit of BPD described “overtime banks” with a planned number of hours in each district and specialized unit used to assign overtime to officers. Rather than just paying for unplanned emergency spending, the department plans in advance to use many overtime hours rather than managing the allotted overtime hours to stay within budget.
The City has yet to publish total overtime spending for FY2022 or to-date spending for FY2023, meaning information about actual overtime budget overages for these fiscal years is still unavailable. However, overtime data for calendar year 2022 is available, and from this we can see that police overtime made up a considerable amount of the City’s overall payroll.
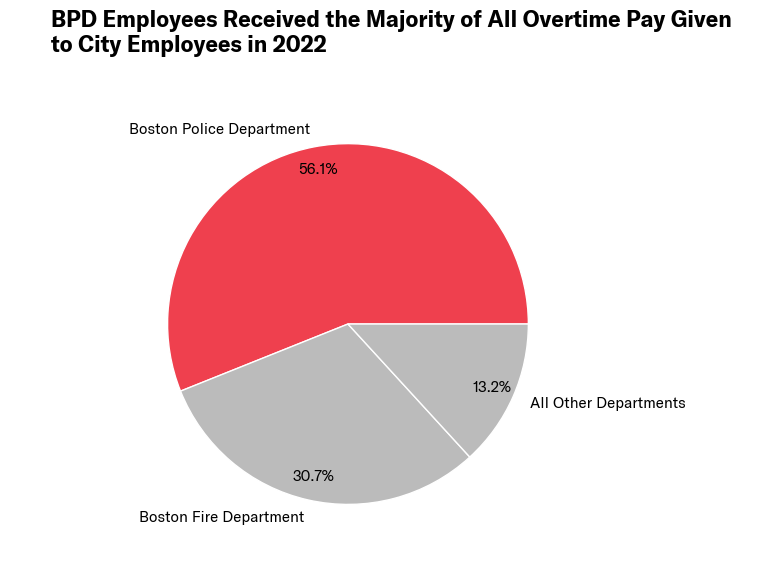
In 2022, 56% of all City overtime pay went to Boston Police Department employees.
Overtime pay still made up a substantial portion of Police Department employee pay; 19.3% of department payroll was for overtime. While most City employees’ overtime is capped as a percentage of their salary, this is not true of police officers. This leads to very high pay for officers who obtain overtime hours to increase their pay and is a major reason that police regularly are the highest paid employees in the City. Despite the size of this overtime spending, the Police Department has historically not been transparent about its processes for managing overtime.
Overtime also continues to be a significant contributor to the pay of the department’s top earners.
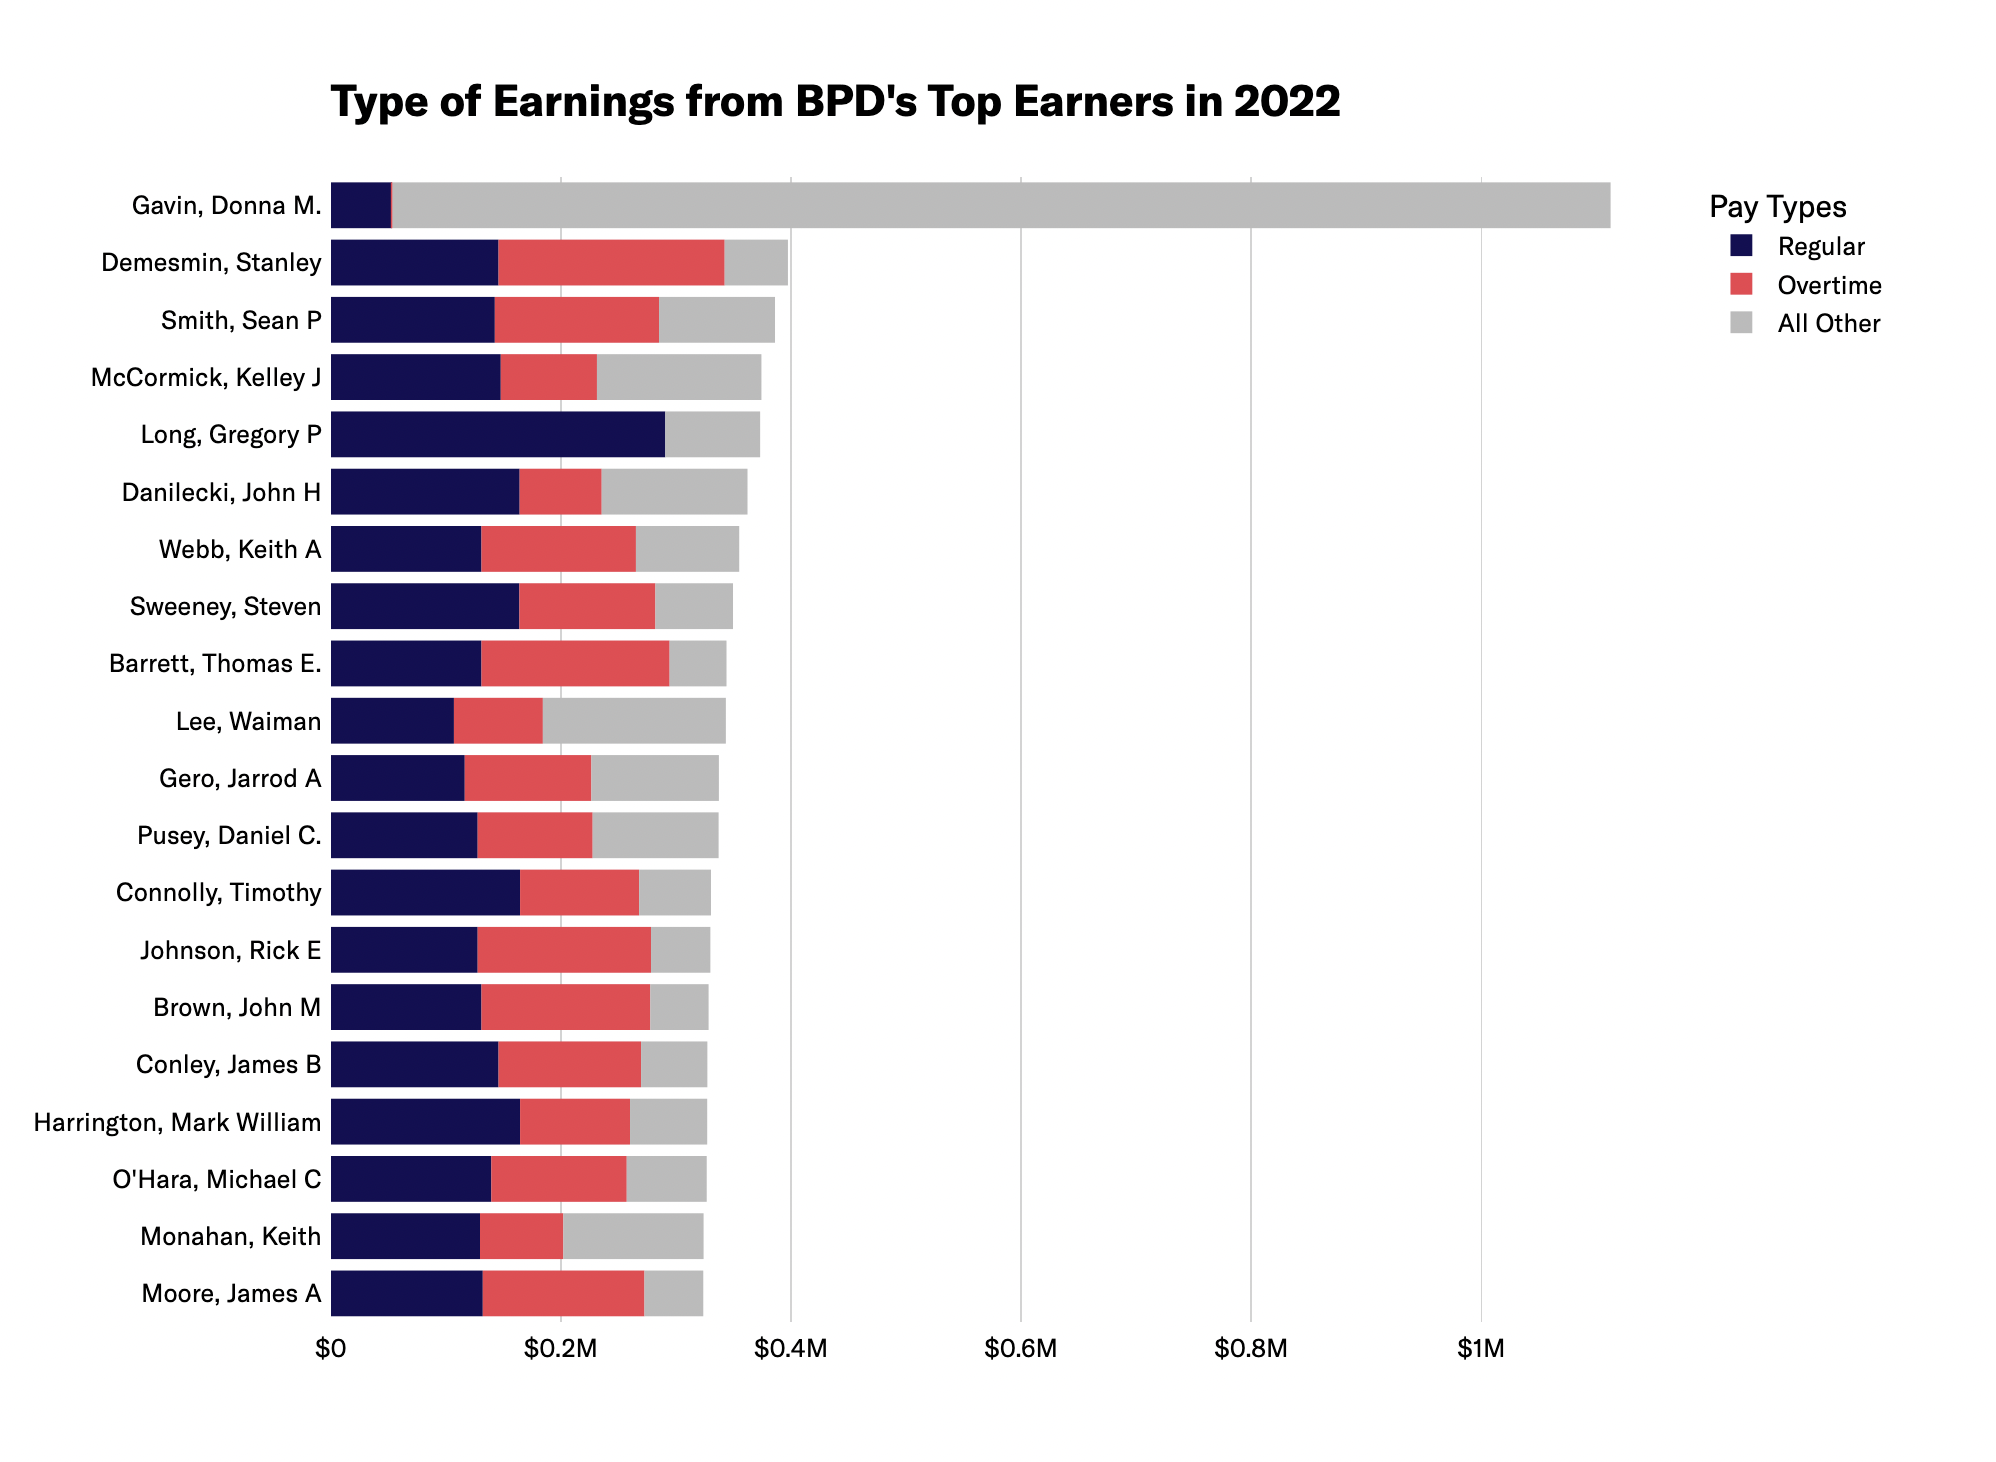
Note: As the result of a gender discrimination lawsuit, the city was ordered to pay millions to Donna M. Gavin, who makes the top earner on this list.
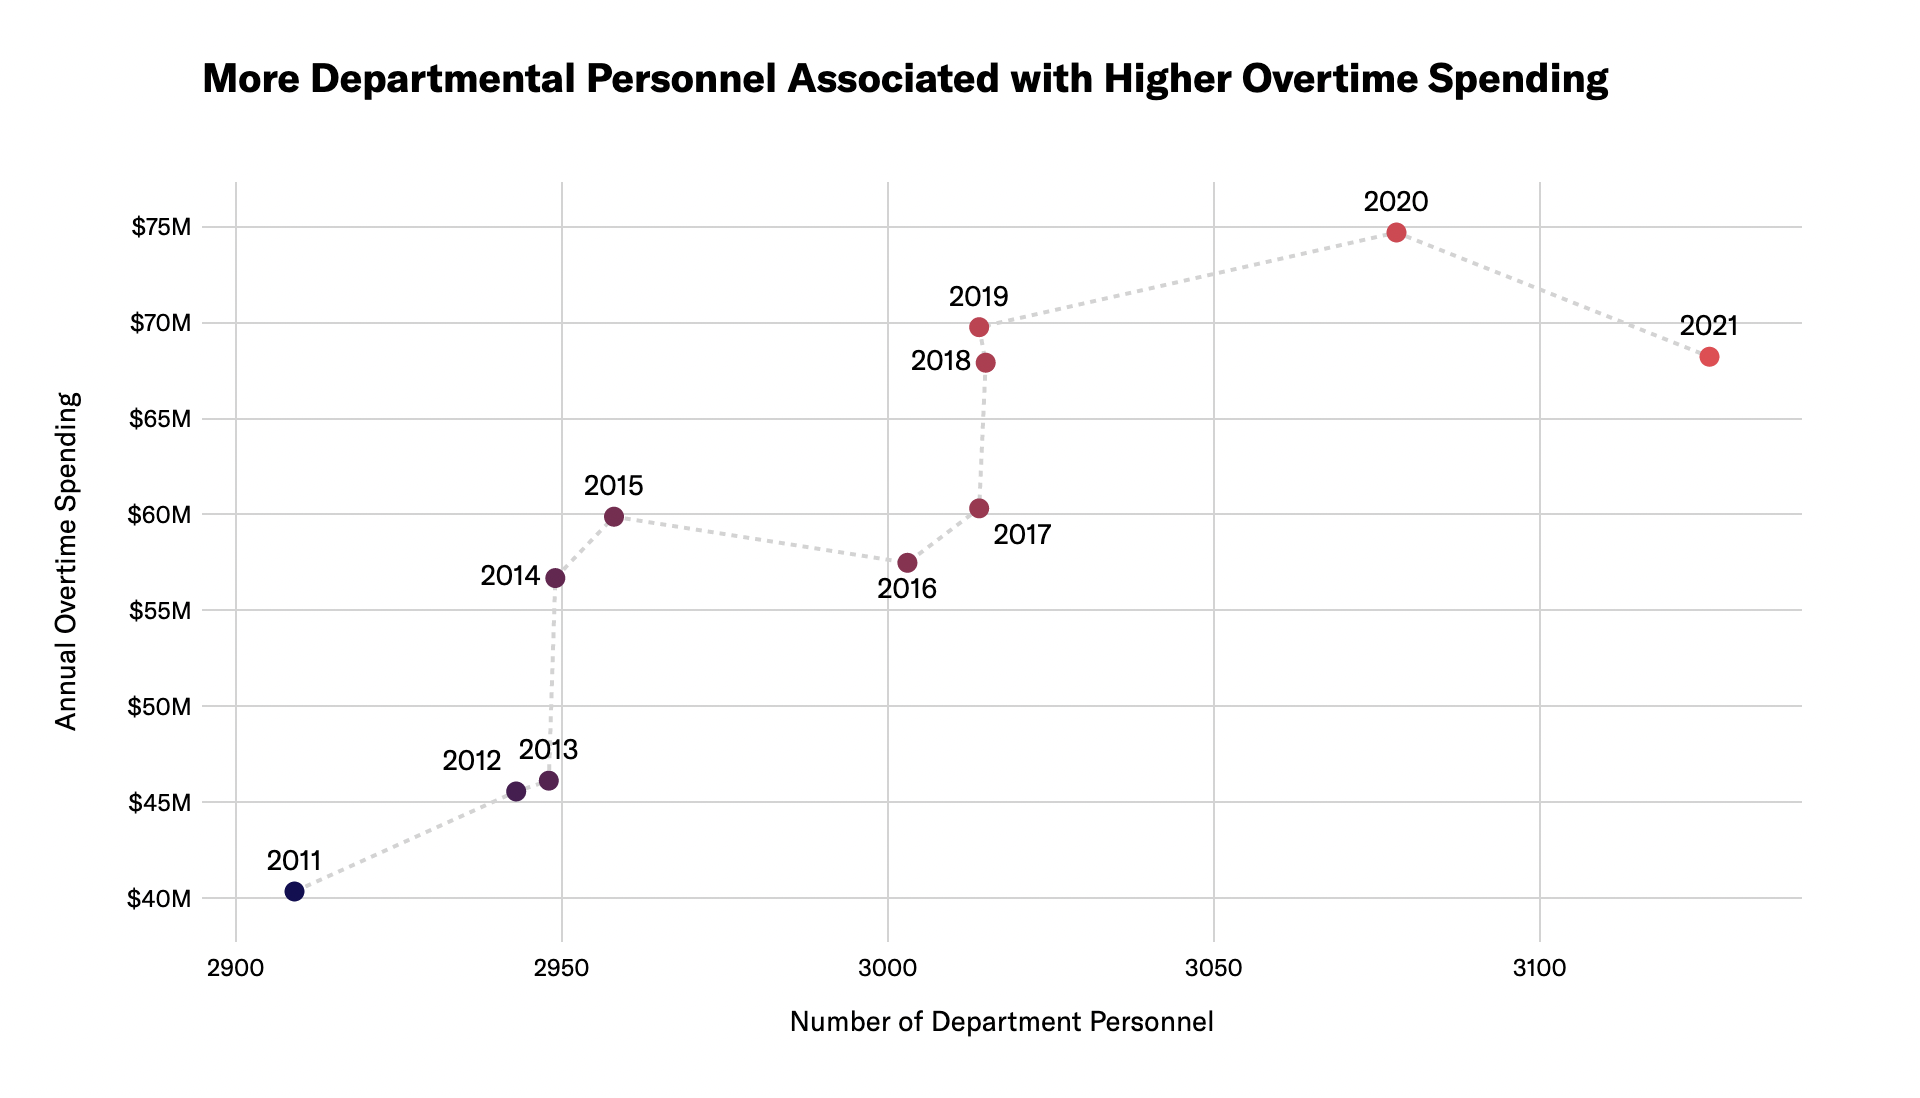
Data suggest hiring more Police Department employees isn’t the solution to overtime spending
At last year’s BPD budget hearings, City Council President Ed Flynn repeated the suggestion that hiring more police officers would help to address excessive overtime costs. But this idea—that BPD’s overtime problem is caused by a shortage of officers—is not supported by the data.
Looking at historical budget data, years with more Boston Police Department personnel are actually associated with higher overtime spending. This new finding adds to our 2021 analysis, which measured departmental size as the full-time equivalents (FTEs) at the BPD and found that there was no correlation between number of Police Department FTEs and overtime spending.
Boston has a larger-than-average police department
Higher staff numbers at BPD have not reduced overtime spending. But misguided claims about overtime spending aren’t the only reasons some City Councilors are calling for more police officers. To contextualize these calls for more officers, we conducted a review of similarly situated communities to see how Boston stacks up. That review shows the Boston Police Department already has a sizable staff.
It is a large department when viewed against other cities with comparable population sizes. A review of available FBI UCR data shows that between 2015 and 2021 Boston consistently retained more officers per resident than the average of other similarly sized cities.
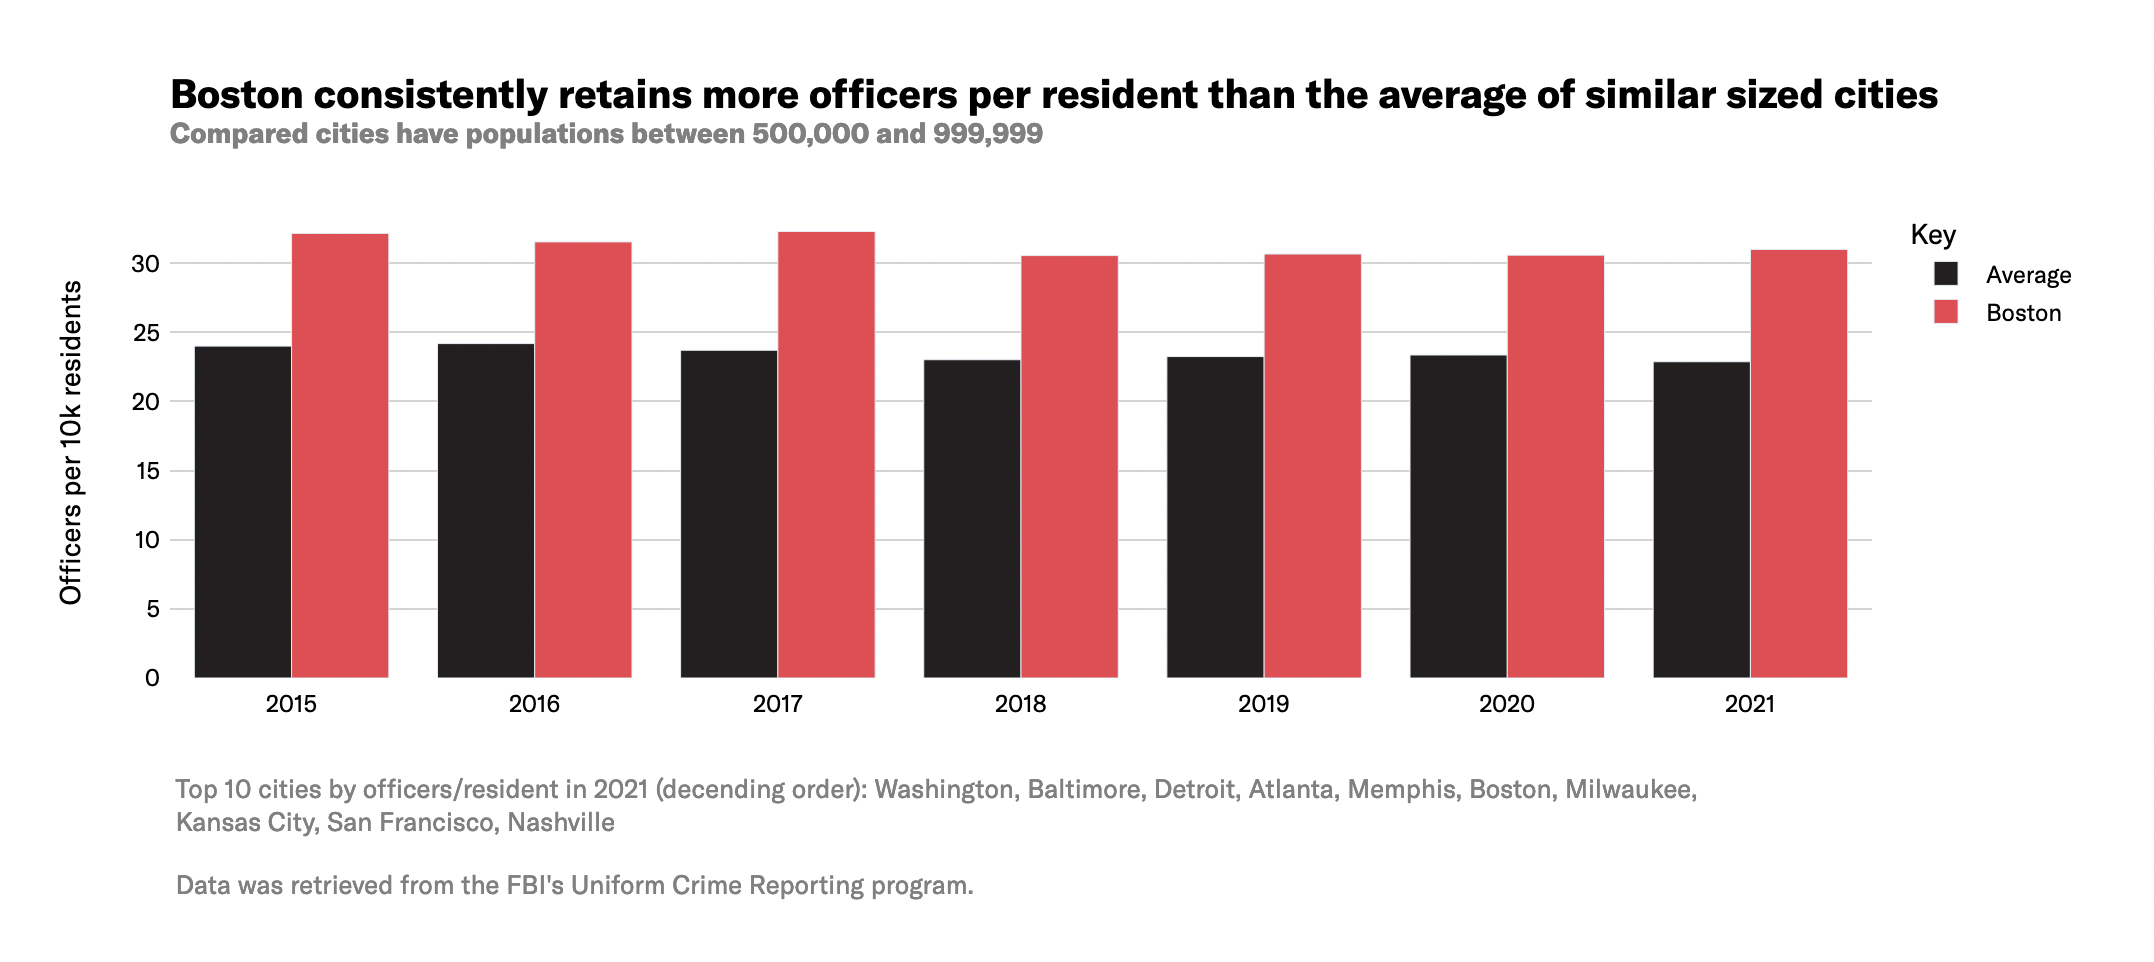
Note: The 23 cities compared were Washington, Baltimore, Detroit, Atlanta, Memphis, Milwaukee, Kansas City, San Francisco, Nashville, Honolulu, Denver, Charlotte, Fort Worth, Albuquerque, El Paso, Oklahoma City, Mesa, Louisville, Seattle, Tucson, Fresno, Sacramento, and Portland.
In 2021, Boston retained more officers per resident than 70% of other similarly sized cities.
Overall, the adopted FY2023 budget for police spending was similar to previous years: costly, with a bloated payroll and tens of millions of dollars for overtime. We’ll soon see how the proposed FY2024 budget compares; the first look will come on or before April 12, 2023 when Mayor Wu submits her budget recommendation to the City Council. We plan to share an analysis of that budget proposal after it becomes available.
Members of the public will have the opportunity to directly share their input on the budget during public hearings, which are expected to be held at the Boston City Council between April and June.
Data Sources
- Boston’s open data portal
-
- Adopted FY2023 operating budget
- City of Boston 2021 and 2022 employee earnings report
- Boston’s City budget website
-
- Current and past fiscal year budgets at bottom of page; information was obtained from the public safety cabinet section of the budget documents
-
- Law Enforcement Employees data
This report was authored by Natasha (ACLUM) and Ryan Yap (Boston University). Data analysis was conducted by Boston University students including Ryan Yap, Xiang Li, Zijie Li, and Hayden Rothman under the supervision of the BU Spark! Program based at the BU Faculty of Computing & Data Sciences and led by Ziba Cranmer (BU) with project management support from Yagev Levi.
The analysis benefitted from crucial feedback from Fatema Ahmad (MJL), Lauren Chambers (UC Berkeley I School; ACLUM), and Youth Justice and Power Union.

Eyes in the Sky: Massachusetts State Police Used Drones to Monitor Black Lives Matter Protests
Records obtained by the ACLU of Massachusetts reveal the State Police routinely fly drones over the Commonwealth, for a variety of purposes, without warrants.
During the summer of 2020, as the nationwide movement against systemic racism grew in the wake of the police murder of George Floyd, the State Police here in Massachusetts (MSP) were busy sending drones to quietly monitor Black Lives Matter protesters across the state.
Records obtained by the ACLU of Massachusetts show the MSP used aerial surveillance to track protests occurring in Fitchburg, Leominster, Gardner, Worcester, Agawam, and Boston. While internal police reports say police did not (in most cases) retain pictures or videos of the protests, the video feeds were streamed in real time to local police departments and the State Police Fusion Center for “situational awareness.”
The records also reveal that the MSP has participated in trainings facilitated by Dave Grossman, a former Army Ranger turned police trainer who has faced extensive criticism for his violent rhetoric. Grossman is infamous for teaching police what he calls “killology,” a so-called “warrior mindset” for officers.
Records obtained by the ACLU last year from the Federal Aviation Administration (FAA) show drones are in use by police departments across the state. Unlike other aerial surveillance technologies such as helicopters and spy planes, drones are easy to deploy, cheap, small, and quiet to operate. According to FAA records, the MSP owns 81 drones—making its program the largest law enforcement drone operation in the state.
The ACLU of Massachusetts filed several public records requests to understand how the MSP uses drones. In response to a request asking for records about drone use since 2020, the MSP told us there were almost 200,000 relevant records. Unfortunately, the MSP asked us to pay for most of them, amounting to a sum we could not afford. After negotiating with the agency, we agreed to narrow our request in the following way. We asked for (i) emails and reports for the time period between May 29, 2020 to June 15, 2020 and (ii) additional reports for the period between January 20, 2022 to May 24, 2022. This resulted in the disclosure of hundreds—instead of hundreds of thousands—of pages of documents. What we obtained therefore only opens a small window onto the MSP’s drone program, but the records nonetheless provide important information about how the MSP uses their drones.
How did the MSP acquire a drone fleet?
According to the records, as of October 2022, the department had 22 drones, including the following makes and models:
- Four Mavic 2 Hasselblads
- Three Mavic 2 Enterprise Duals
- Two Sparks
- Three Matrice 300 RTKs
- Eight Mavic Minis
- One Phantom 4 Pro+
The two most advanced drones are the Mavic 2 Enterprise Dual and the Matrice 300 RTK.
- The Mavic 2 Enterprise Dual: This powerful drone has thermal imagery capabilities, an integrated radiometric thermal sensor, adjustable parameters for emissivity and reflective surfaces, and multiple display modes.
- The Matrice 300 RTK: This is also a very advanced model—at the time of writing, the latest one released by the manufacturer DJI—offering up to 55 minutes of flight time, machine learning technology that recognizes a subject of interest and identifies it in subsequent automated missions to ensure consistent framing, six directional sensing and positioning, and 15km-1080p map transmission.
The records show the federal government financed the expansion of the MSP drone program, with the state government as an intermediary. In 2019, the MSP received an award of $99,011 from the state government to purchase drones. The funding came from the Homeland Security Grant Program, a Department of Homeland Security funding stream available to all states. This federal funding, passed through the state, allowed the State Police to purchase nine drones from a company called Safeware.
The MSP’s drone policy
The MSP also produced a policy to govern the department’s use of drones. The policy includes some important civil rights protections, but needs substantial work. And crucially, an ACLU review of records provided by the MSP indicates the department’s compliance with the policy appears to be inconsistent.
The policy establishes that drones may be used for a list of purposes that is far too broad, leaving the door open to abuse and misuse. The policy should explicitly list all permissible purposes for drone use. Instead, it takes an open-ended approach. For example, the records show “Homeland Security” is listed as a permissible purpose for drone usage. But this vague phrase is open to extremely broad interpretation, and could be used to justify drone usage in almost any scenario.
The policy states that the drone program is operated by the Unmanned Aerial Section of the Homeland Security and Preparedness division of the MSP. But “Homeland Security” has nothing to do with the vast majority of enumerated purposes listed in the policy, such as accident reconstruction, missing persons investigations, and criminal investigations surveillance. It is likely that the “Homeland Security” division is in charge of the drone program simply because the money for most of the drones came from the federal DHS, not because the drones are actually used in operations relative to “homeland security” operations.
The policy requires police to obtain a warrant or court order to use a drone in a criminal investigation, where a person has a reasonable expectation of privacy (except in exigent circumstances). However, in response to our requests, the MSP did not produce a single search warrant, indicating that the department has never obtained one to use a drone for surveillance purposes. There could be several reasons for this. It’s possible that police are: 1)simply not using drones in criminal investigations, 2) using them without a warrant in violation of the policy, 3) defining “reasonable expectation of privacy” too narrowly, or 4) simply using drones only to investigate criminal activity when exigent circumstances make getting a warrant impractical. Regardless, the fact that the MSP has never once obtained a warrant to use a drone indicates that the policy does not offer sufficient privacy protection. This suggests that we need a law on the books to enforce our rights.
Current privacy protections are not enough
To the MSP’s credit, their policy incorporates the principle of data minimization. This means that in order for any data to be collected with a drone, that data must be essential to complete the objective of the drone mission. Additionally, the policy states that drones cannot be paired with facial recognition technology to identify individuals in real time, and may not be used to carry weapons or facilitate the use of any weapons and/or dispersal payloads. These are important protections, and the ACLU applauds the MSP for including them.
That said, other language in the policy meant to protect civil rights and civil liberties is weak. For example, the policy forbids police from using a drone to target a person based solely on individual characteristics such as race, ethnicity, national origin, religion, disability, gender, or sexual orientation. But the inclusion of the word “solely” leaves open the possibility that the police will target someone in part on the basis of a protected characteristic like their race or national origin.
Likewise, the policy forbids the collection, use, retention, or dissemination of data in any manner that would violate the First Amendment or in any manner that would unlawfully discriminate against persons based upon their ethnicity, race, gender, national origin, religion, sexual orientation, or gender identity. But case law is underdeveloped and insufficient in these areas, leaving decision making about what constitutes a First Amendment violation or discrimination up to the police. Instead, the language should clearly stipulate that the MSP shall not use drones to monitor people exercising their First Amendment rights to assemble, petition the government, exercise their religion, or protest.
Instead, the policy allows drone footage to be collected, processed, used, and shared in a broad range of situations that threaten core civil rights and civil liberties. And this is exactly what’s happened, such as when the MSP, in partnership with local police, used drones to surveil Black Lives Matter protests across the state. Under the guise of “crowd control, traffic incident management, and temporary perimeter security,” the MSP was actively surveilling people exercising their First Amendment rights. The MSP should strengthen their policy to prohibit the collection and processing of drone information concerning First Amendment expression.
Finally, the policy is silent on a critical issue: data sharing. As a result, we do not know who has access to drone footage collected by the MSP, under what circumstances, or subject to what type of request. The lack of any information about data sharing is particularly concerning given the involvement of the Commonwealth Fusion Center in the drone program.
How has the MSP used drones?
While the policy sets out how drones ought to be used, emails, communications, and reports show how the MSP actually uses its drones. To that end, we obtained drone flight logs covering the period between January and May 2022. Generally, those records show that drones were mostly used in the following places:
You can access an interactive map here.
Municipalities where the Mass State Police conducted drone flights between January 1 and May 24, 2022
The records show that the MSP used drones for the following purposes during this time period:
- Monitoring Black Lives Matter protests and rallies in Fitchburg, Leominster, Gardner, Worcester, Agawam, and Boston;
- In criminal investigations, for example an attempt to locate evidence related to a New Hampshire State Police investigation (the MSP found no evidence);
- Finding missing persons;
- Mapping accident scenes;
- Mapping airports;
- Transit purposes;
- Investigating the operation of private drones; and
- Training and mapping exercises.
Note that the category “Search & Rescue” includes missions ranging from searching for missing persons to searching for suspects in criminal investigations. Of the 25 flights labeled “Search & Rescue,” at least 7 are related to criminal investigations or searches for suspects, and 18 related to missions looking for missing persons such as elderly people or people with mental health issues. These are very different kinds of missions, and the MSP should group them into different categories in order to facilitate greater transparency and accountability.
Learning more about government use of drones in Massachusetts
The records published here provide a glimpse into drone use at the MSP. But the MSP is not alone—many other police departments across the state use drones. During the summer of 2022, the Public Safety Subcommittee of Worcester City Council was the stage for a public outcry when community members expressed their concerns about the police department’s proposal to acquire drones. The Boston Police Department also has a large drone program.
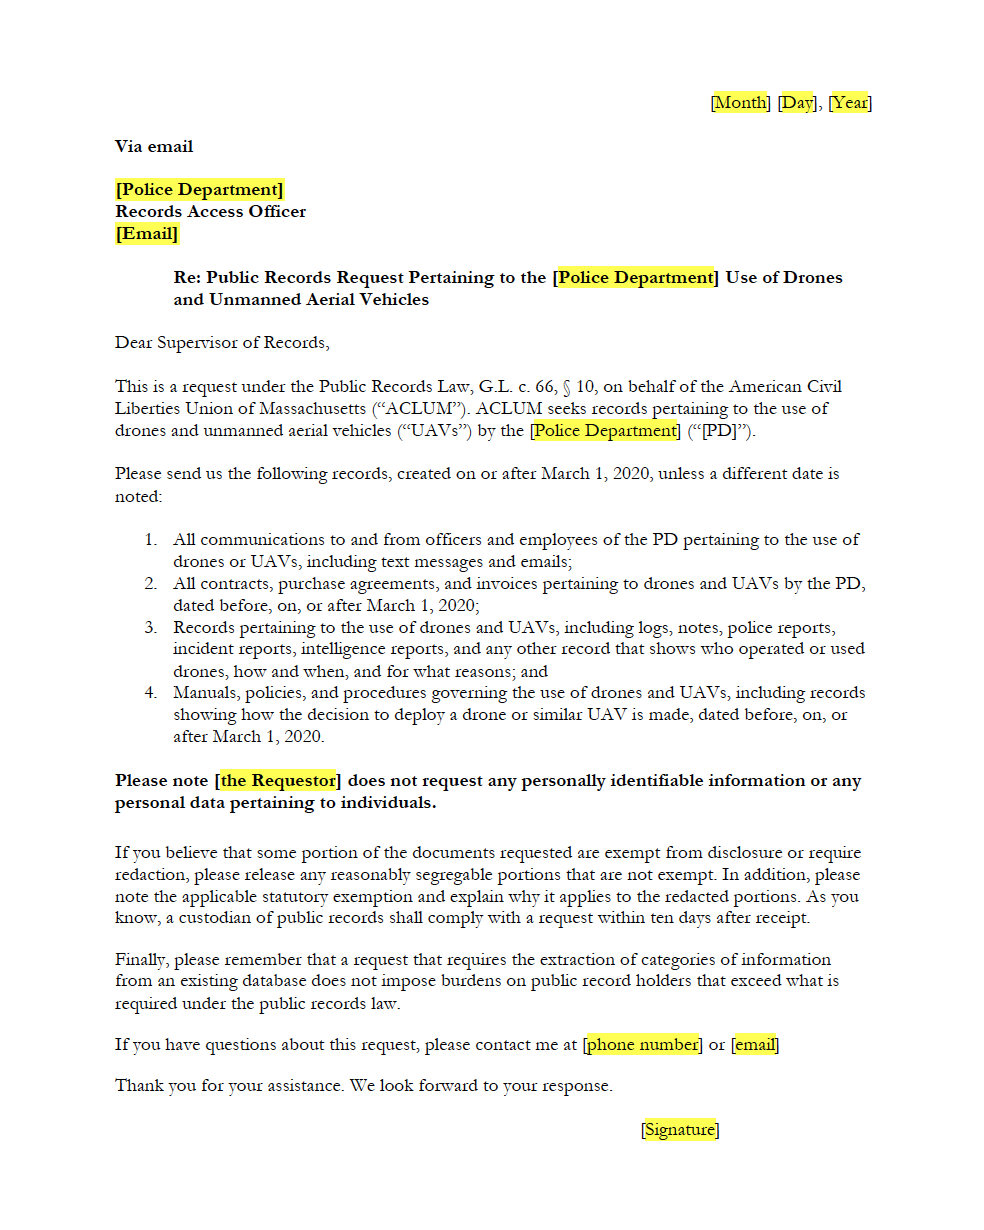
If you’re interested in learning more about how government agencies in Massachusetts use drones, you can use our model public records request to find out. More information about this process and resources are available through the tool linked below.
If you find anything interesting, please contact us at data4justice@aclum.org.

Massachusetts Arrest Records Signal Troubling Racial Disparities
New analysis from students at the Boston University Spark! Lab and the ACLU of Massachusetts Data for Justice Project reveal troubling racial disparities in arrests in communities across Massachusetts. Our analysis uses data newly available thanks to ACLU advocacy in 2018, which led to the inclusion in that year’s omnibus criminal law reform legislation of language mandating the collection and reporting of statewide arrest data.
Section 5 of Chapter 69 of the Massachusetts General Laws requires all police departments to collect and report arrest data statistics to the Executive Office of Public Safety and Security (EOPSS), which is required to post this information online. These records allow residents, researchers, advocates, lawmakers, journalists and other interested parties to see how specific police departments use their arrest powers and enable us to conduct statewide reviews to compare departments to one another.
Arrests data from 2020 show signs of significant racial disparities.
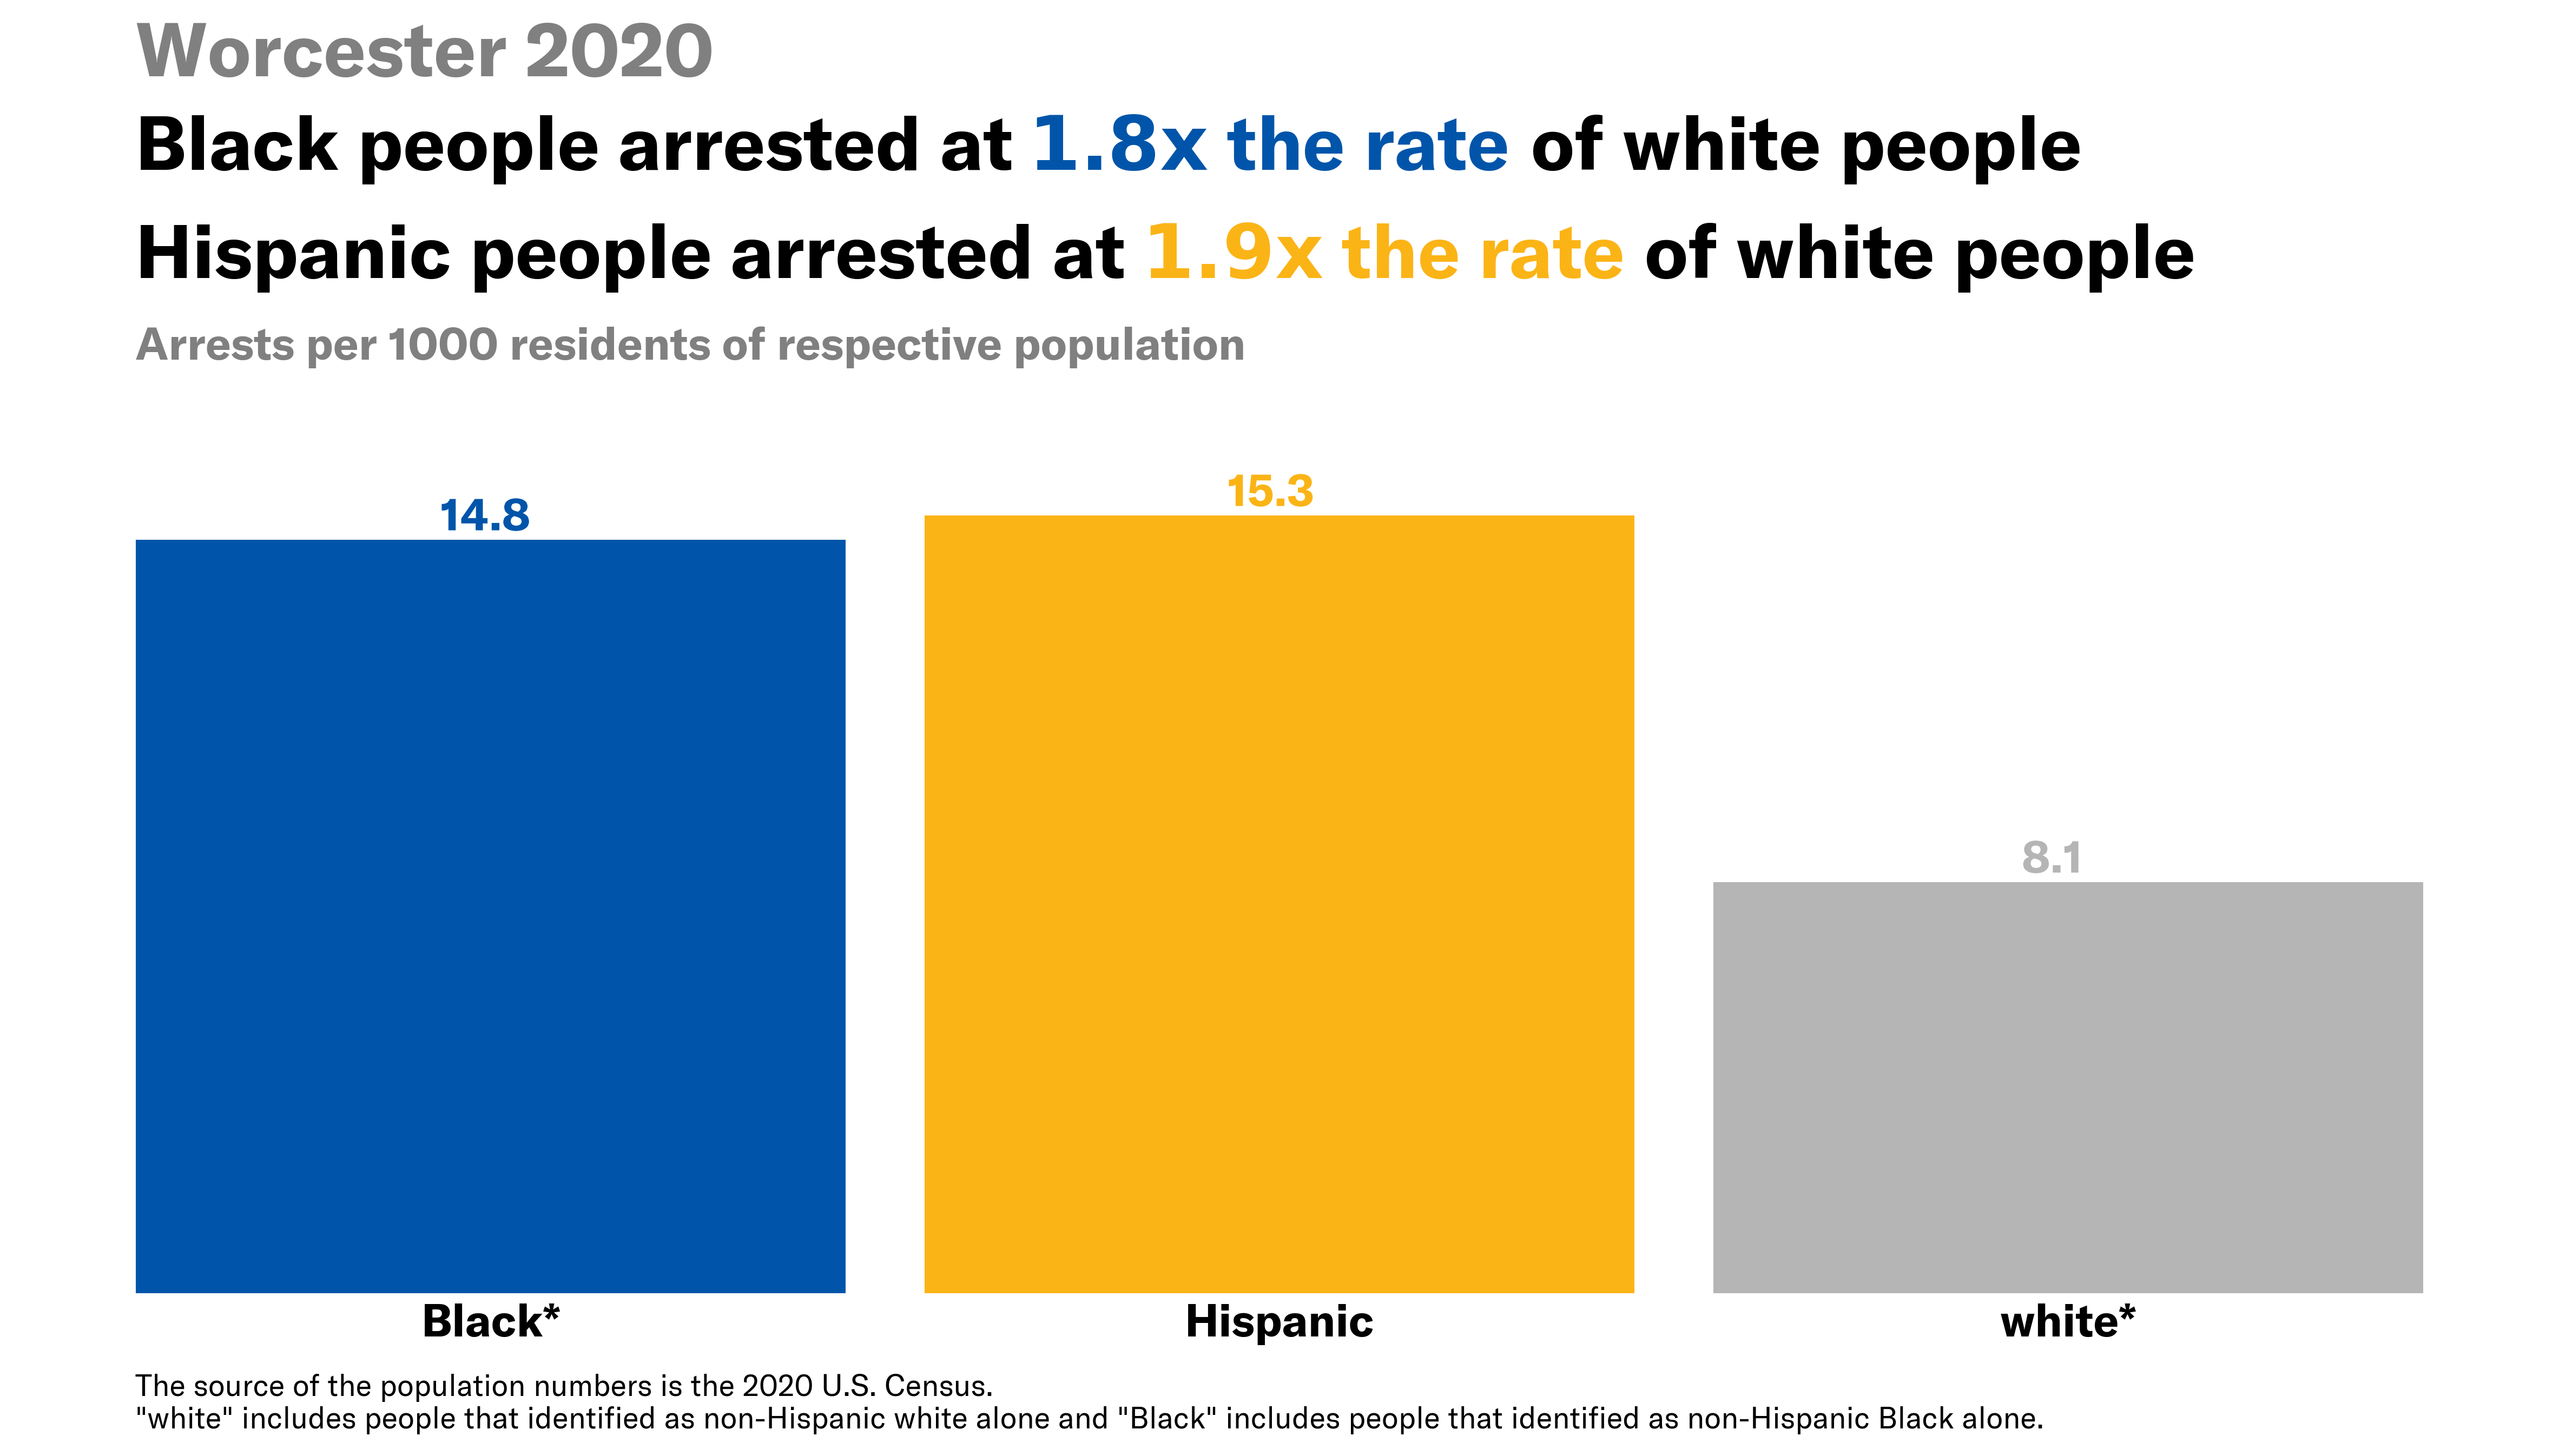
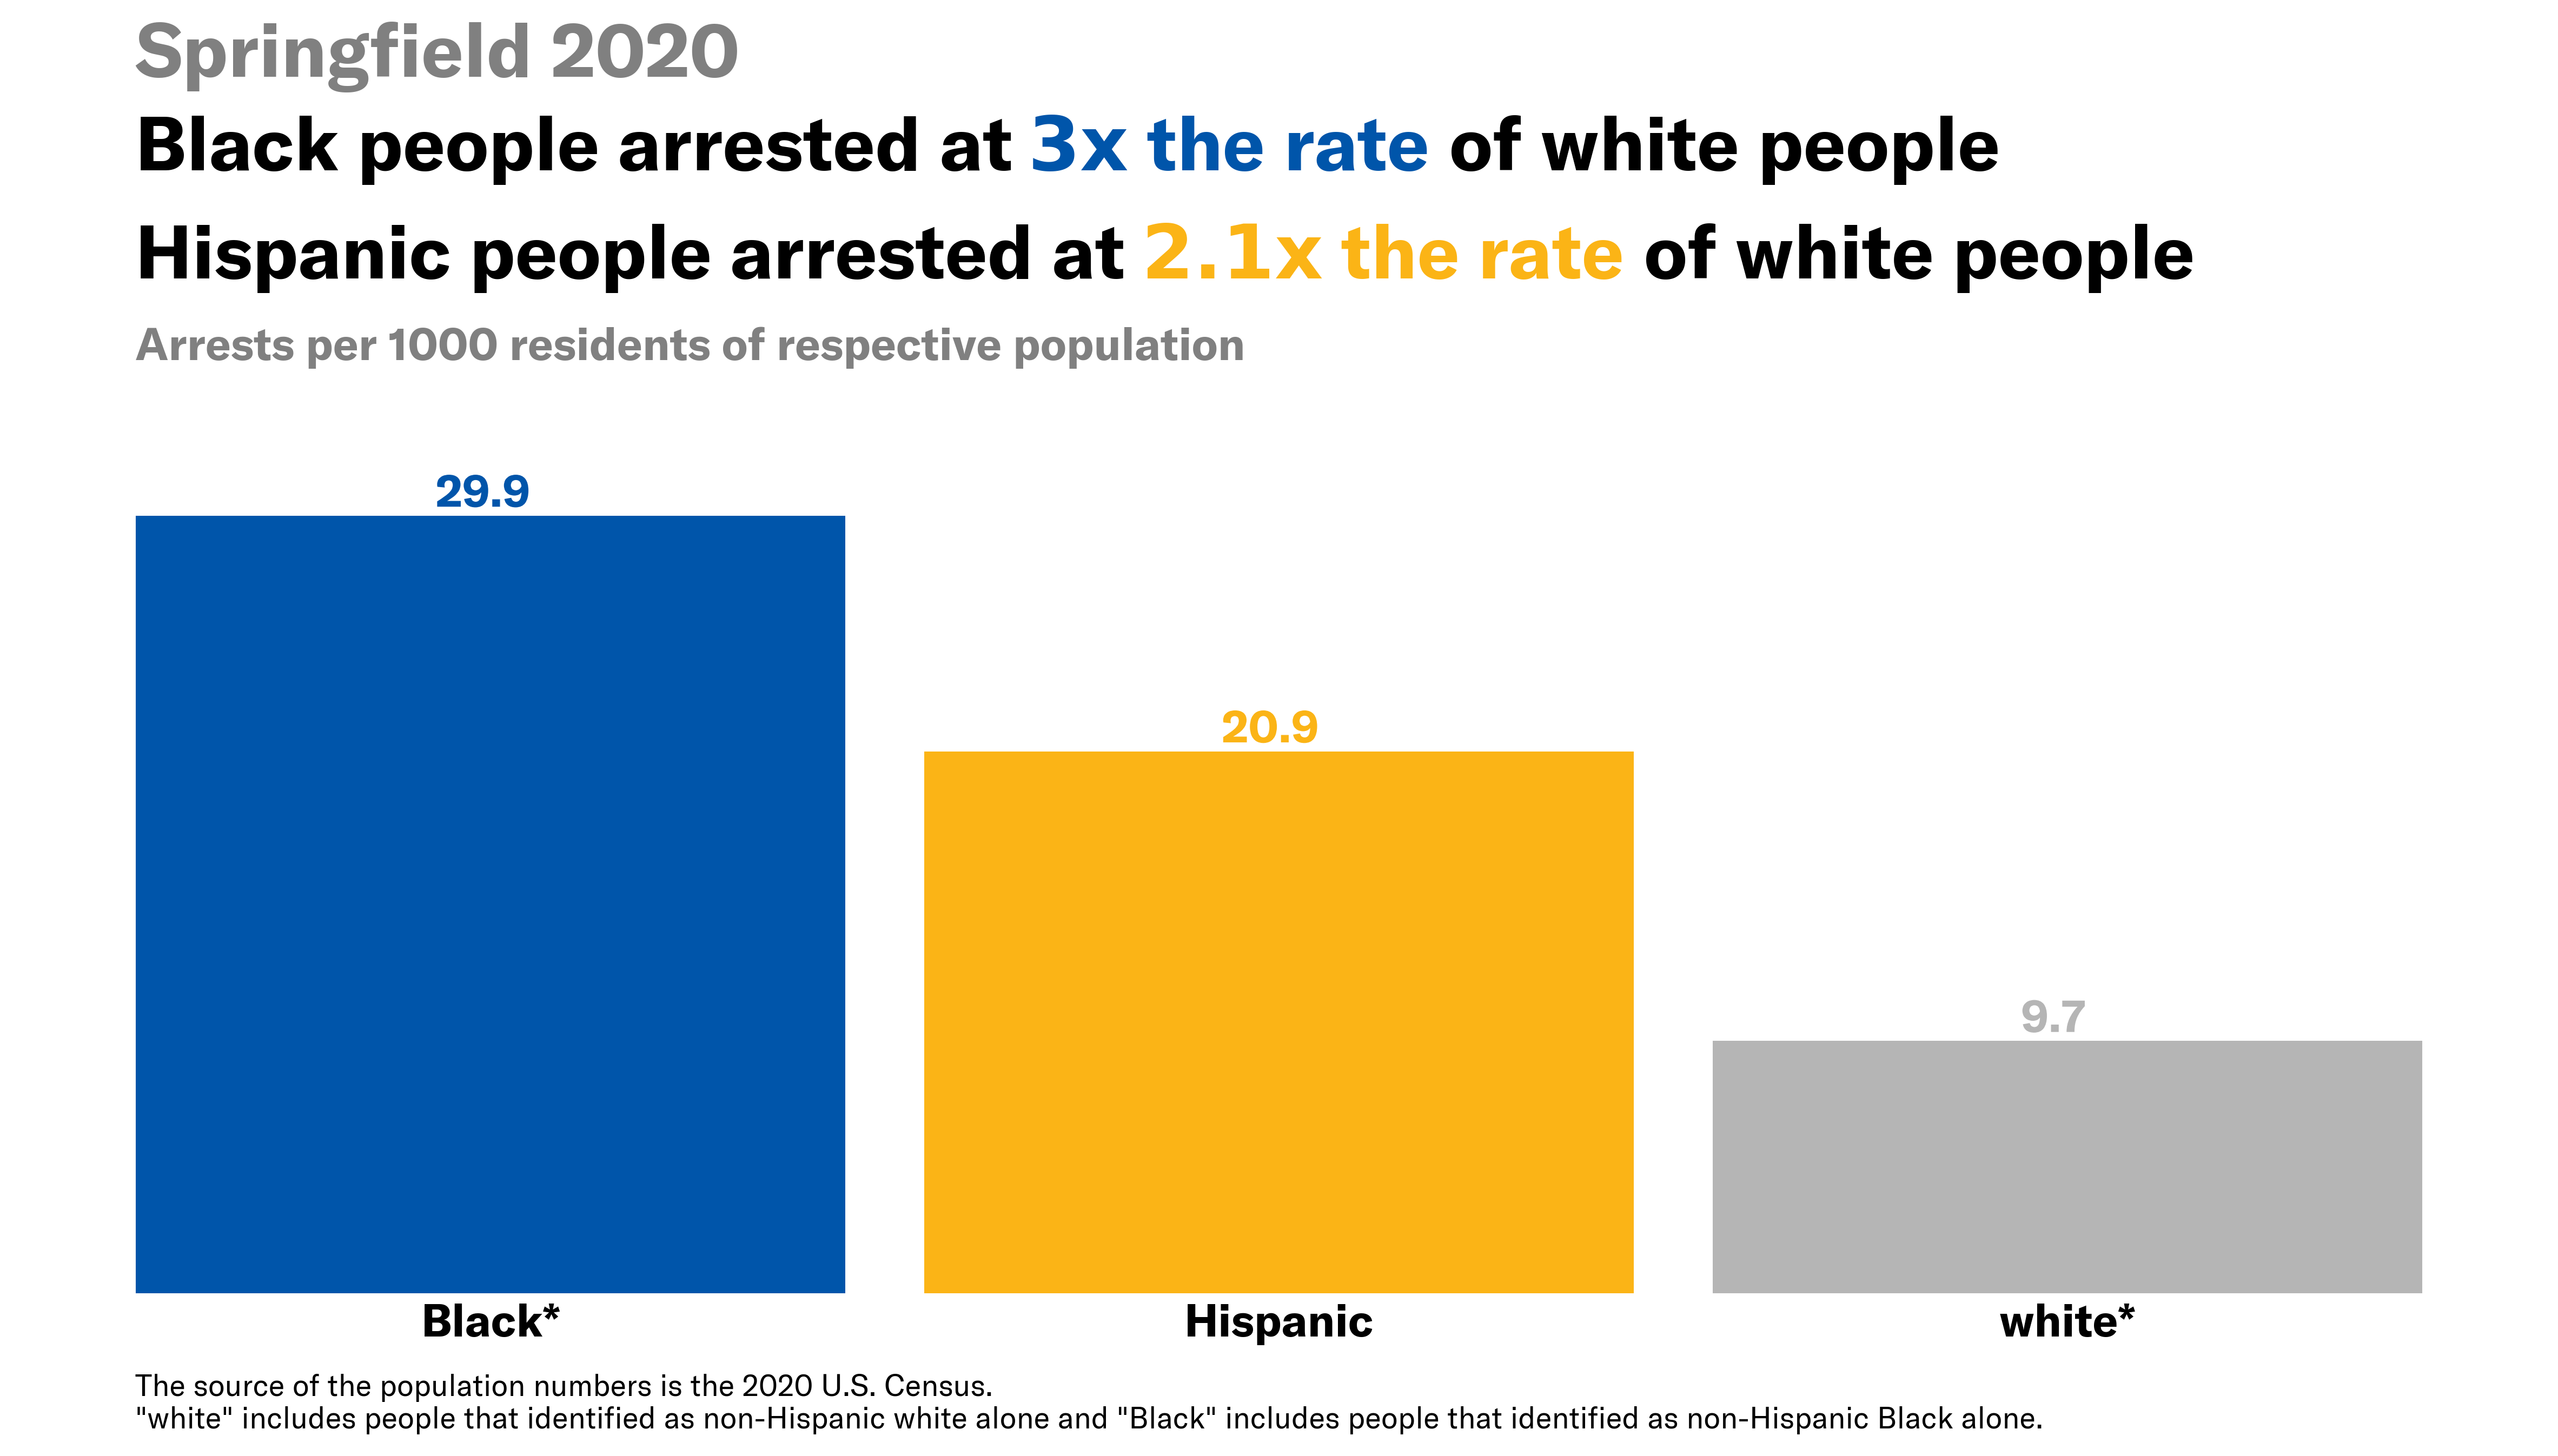
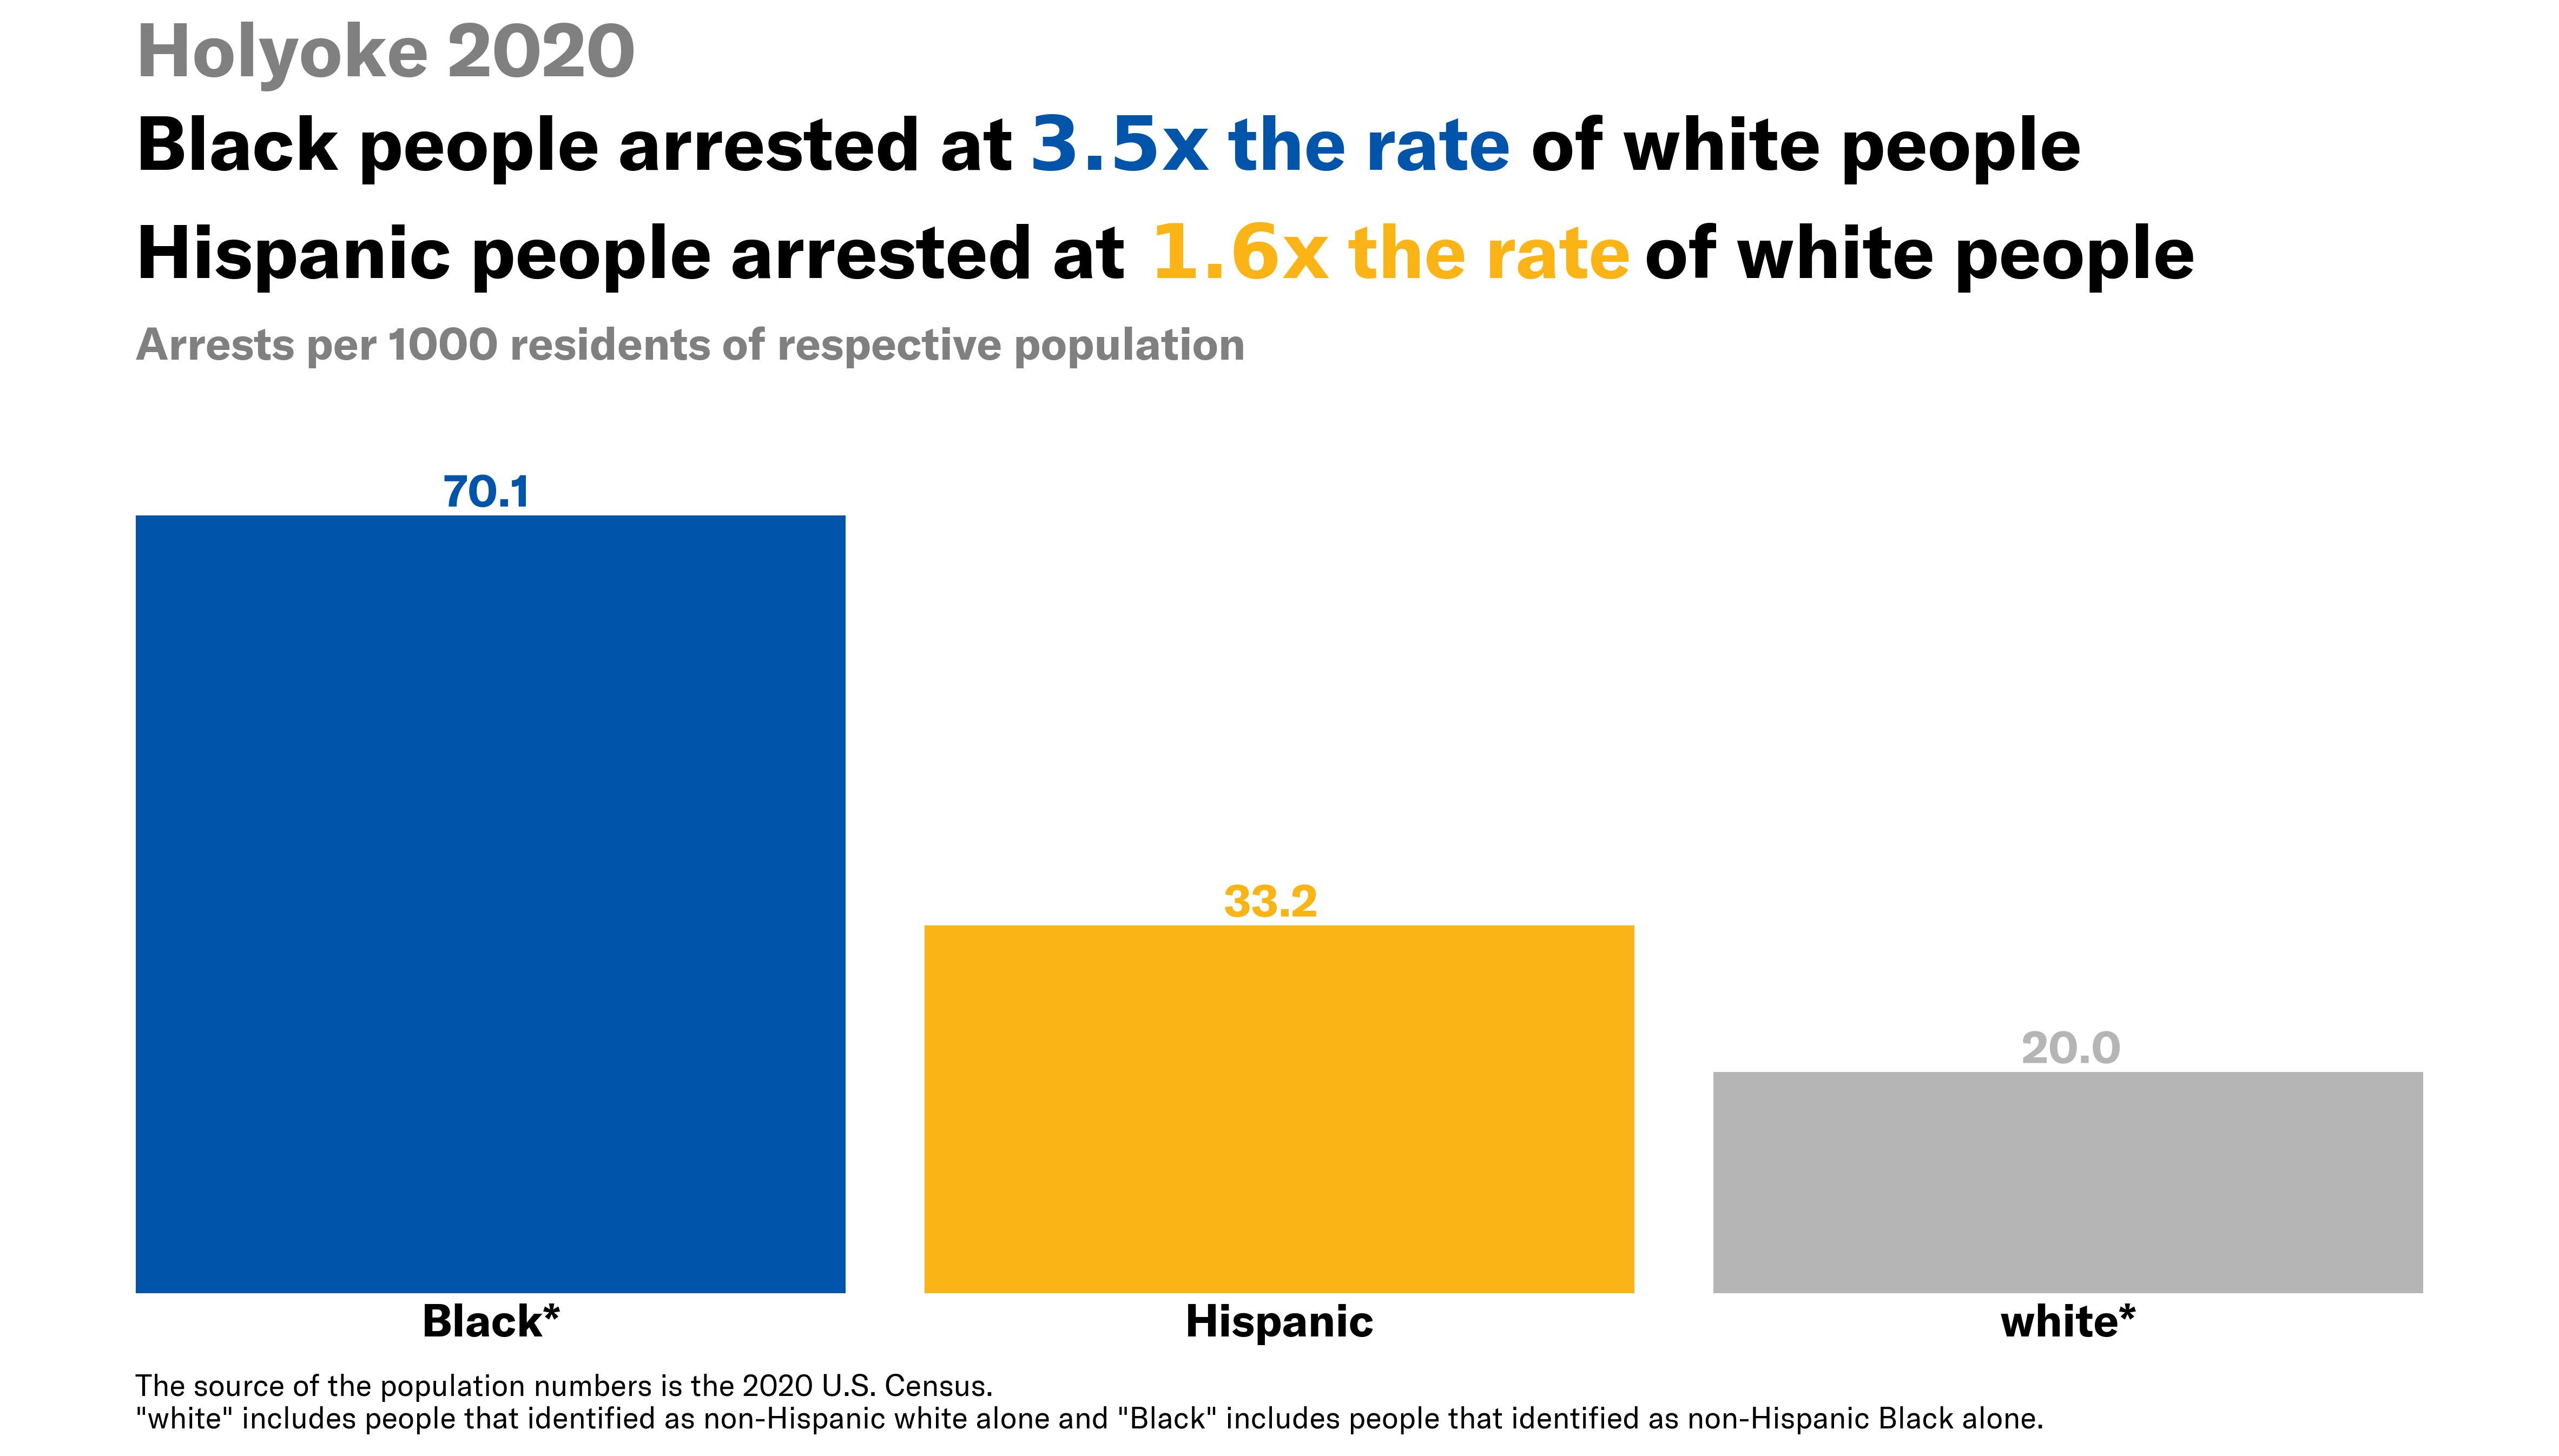
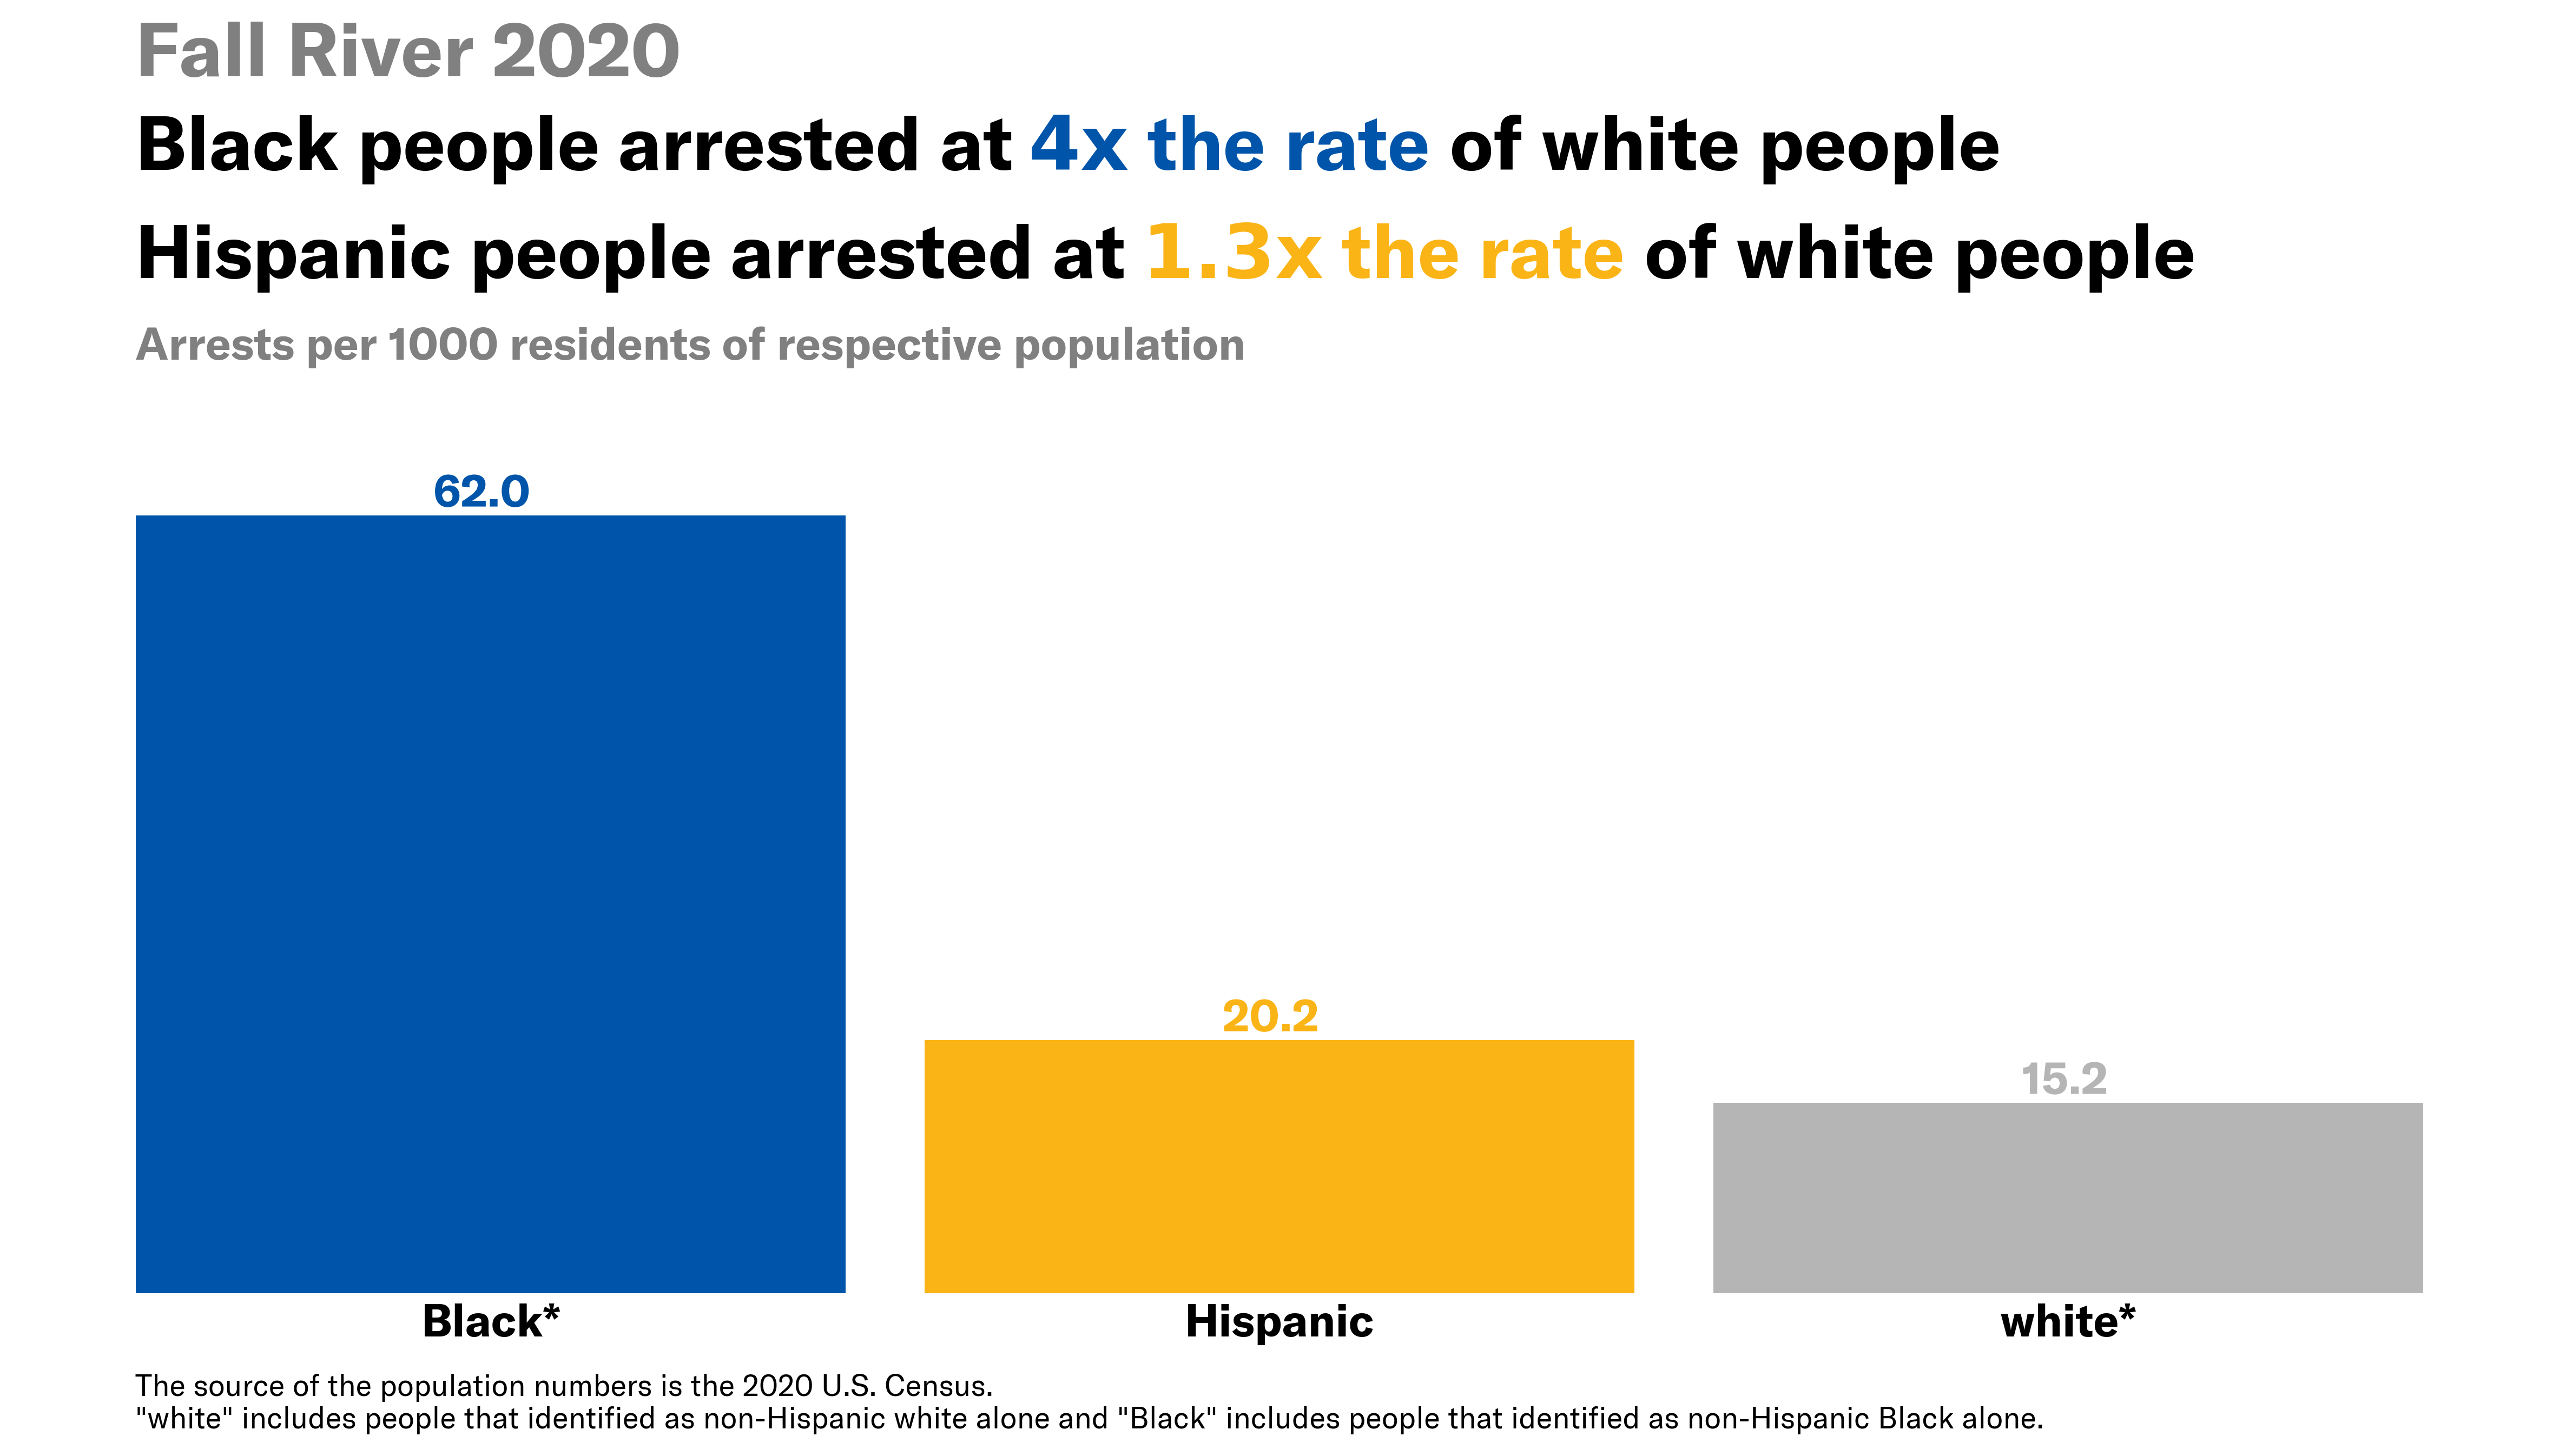
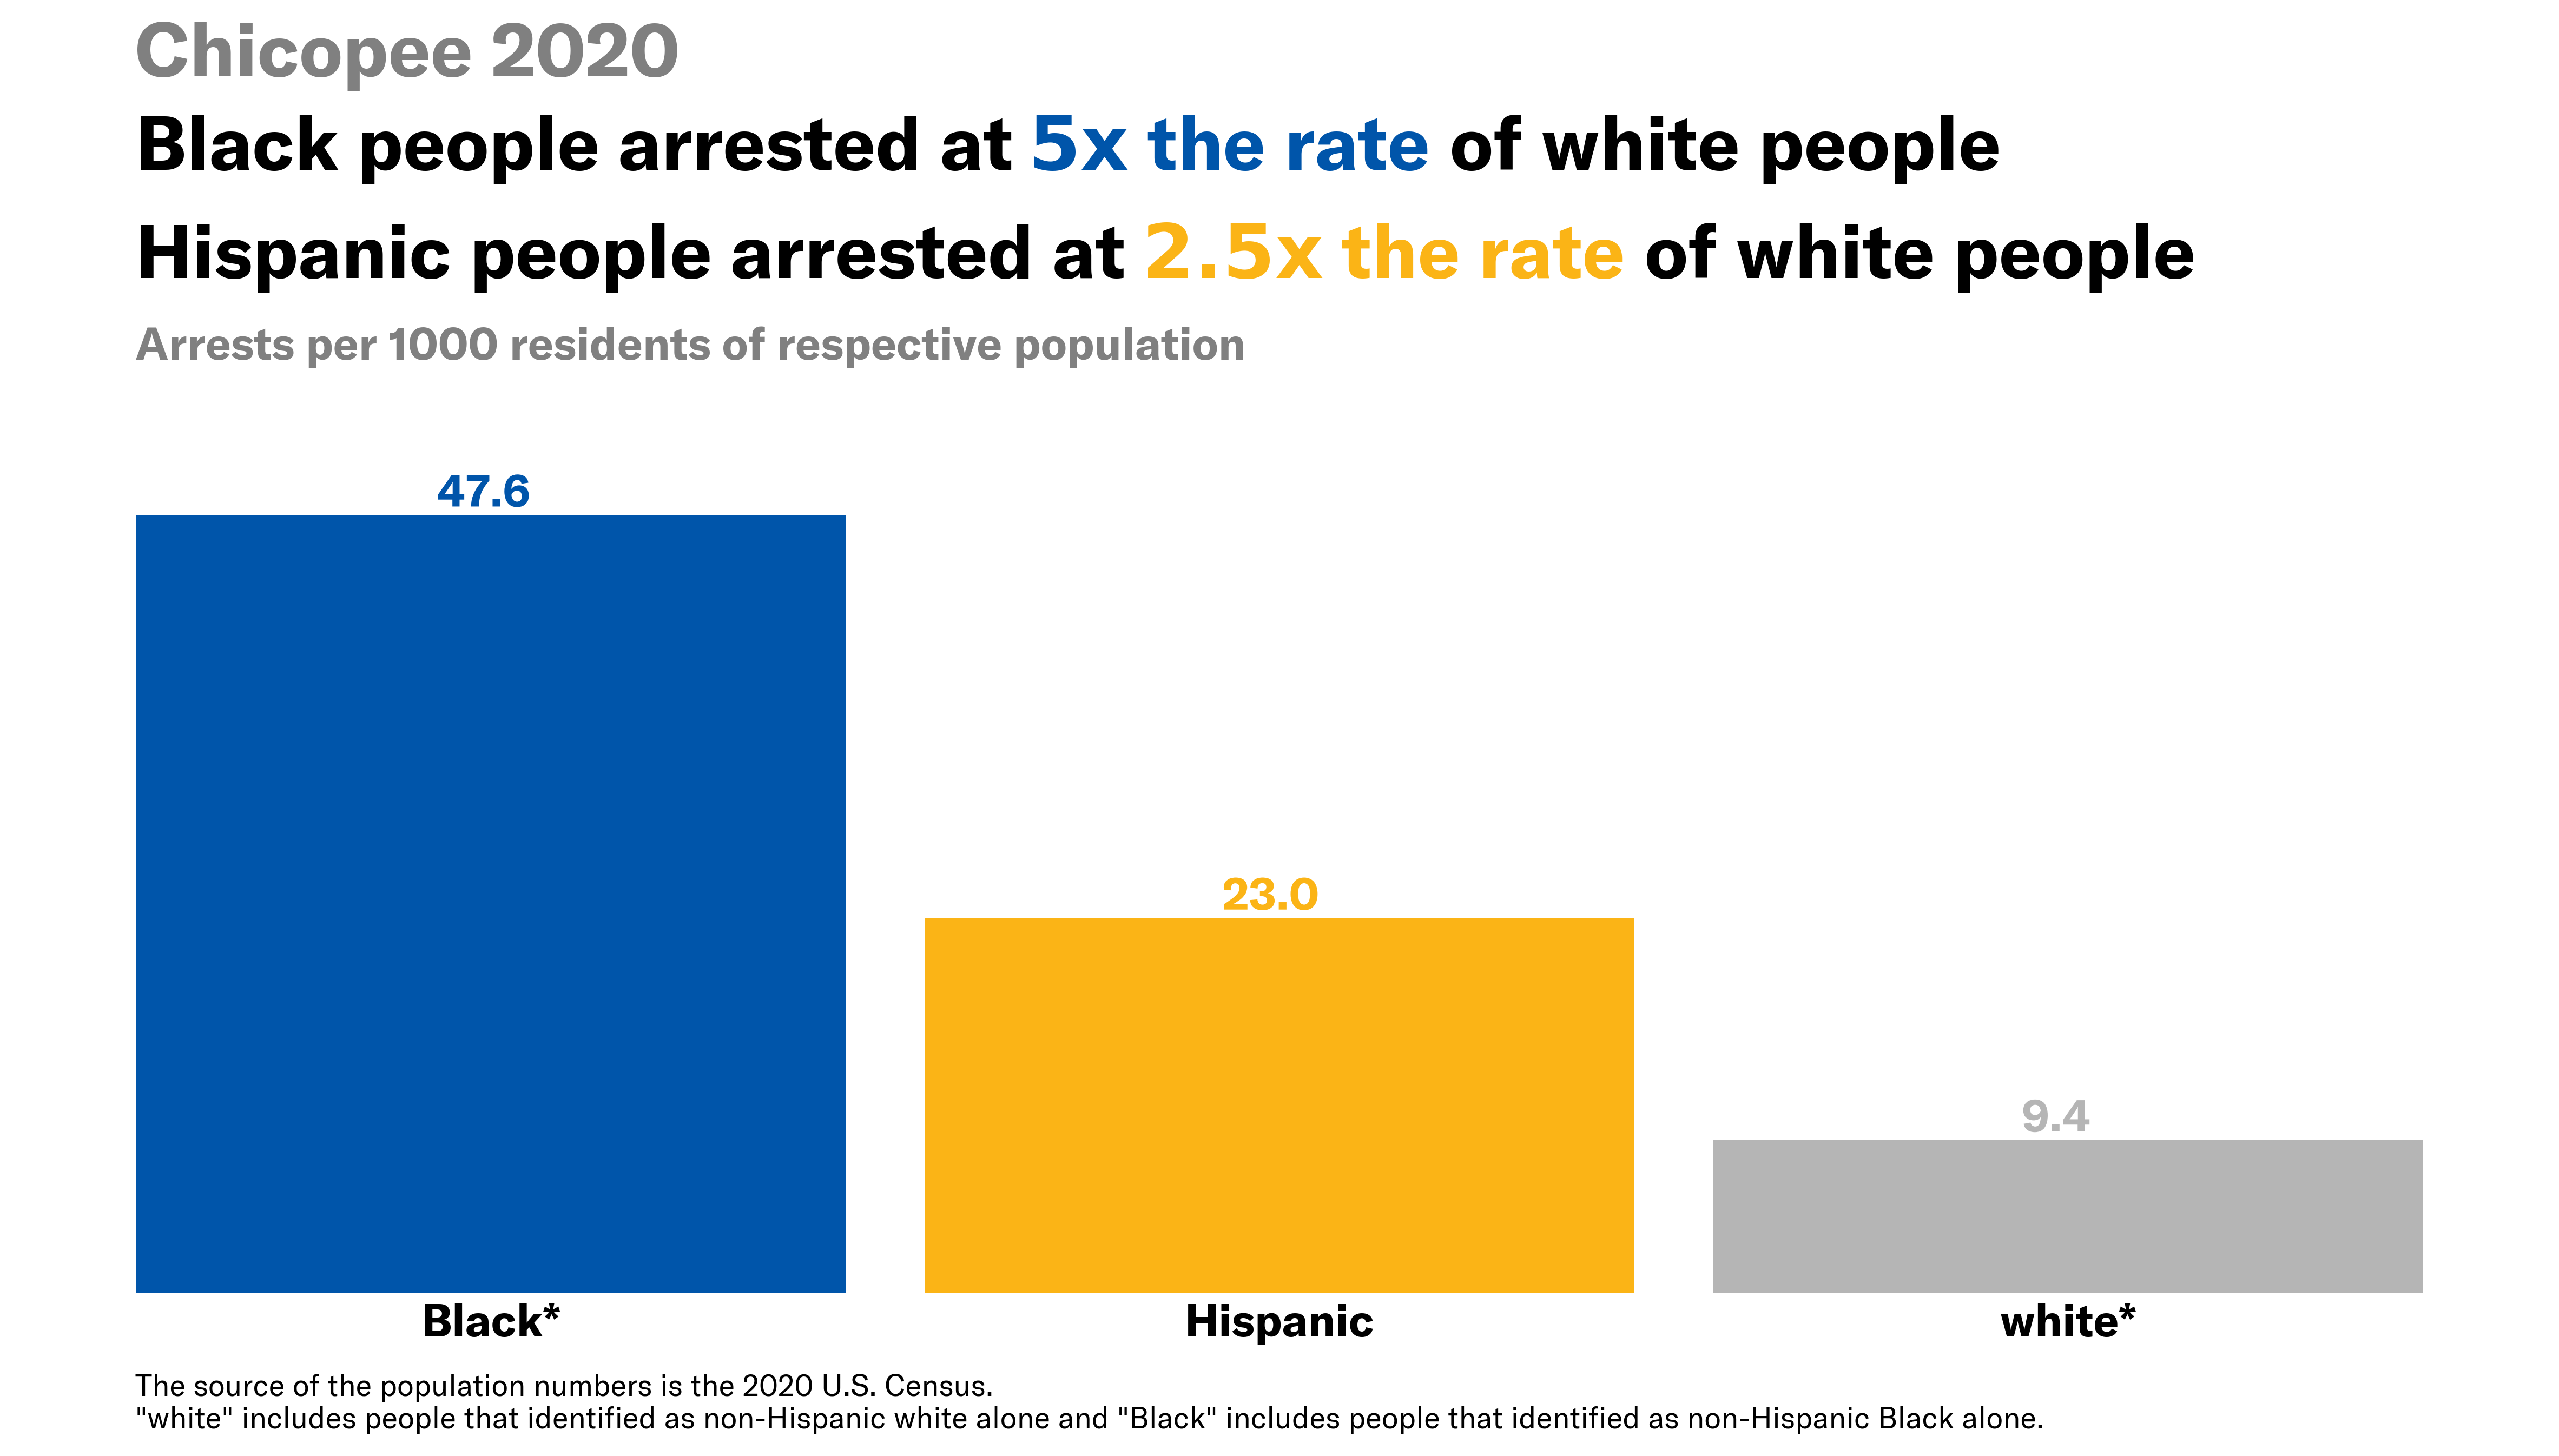
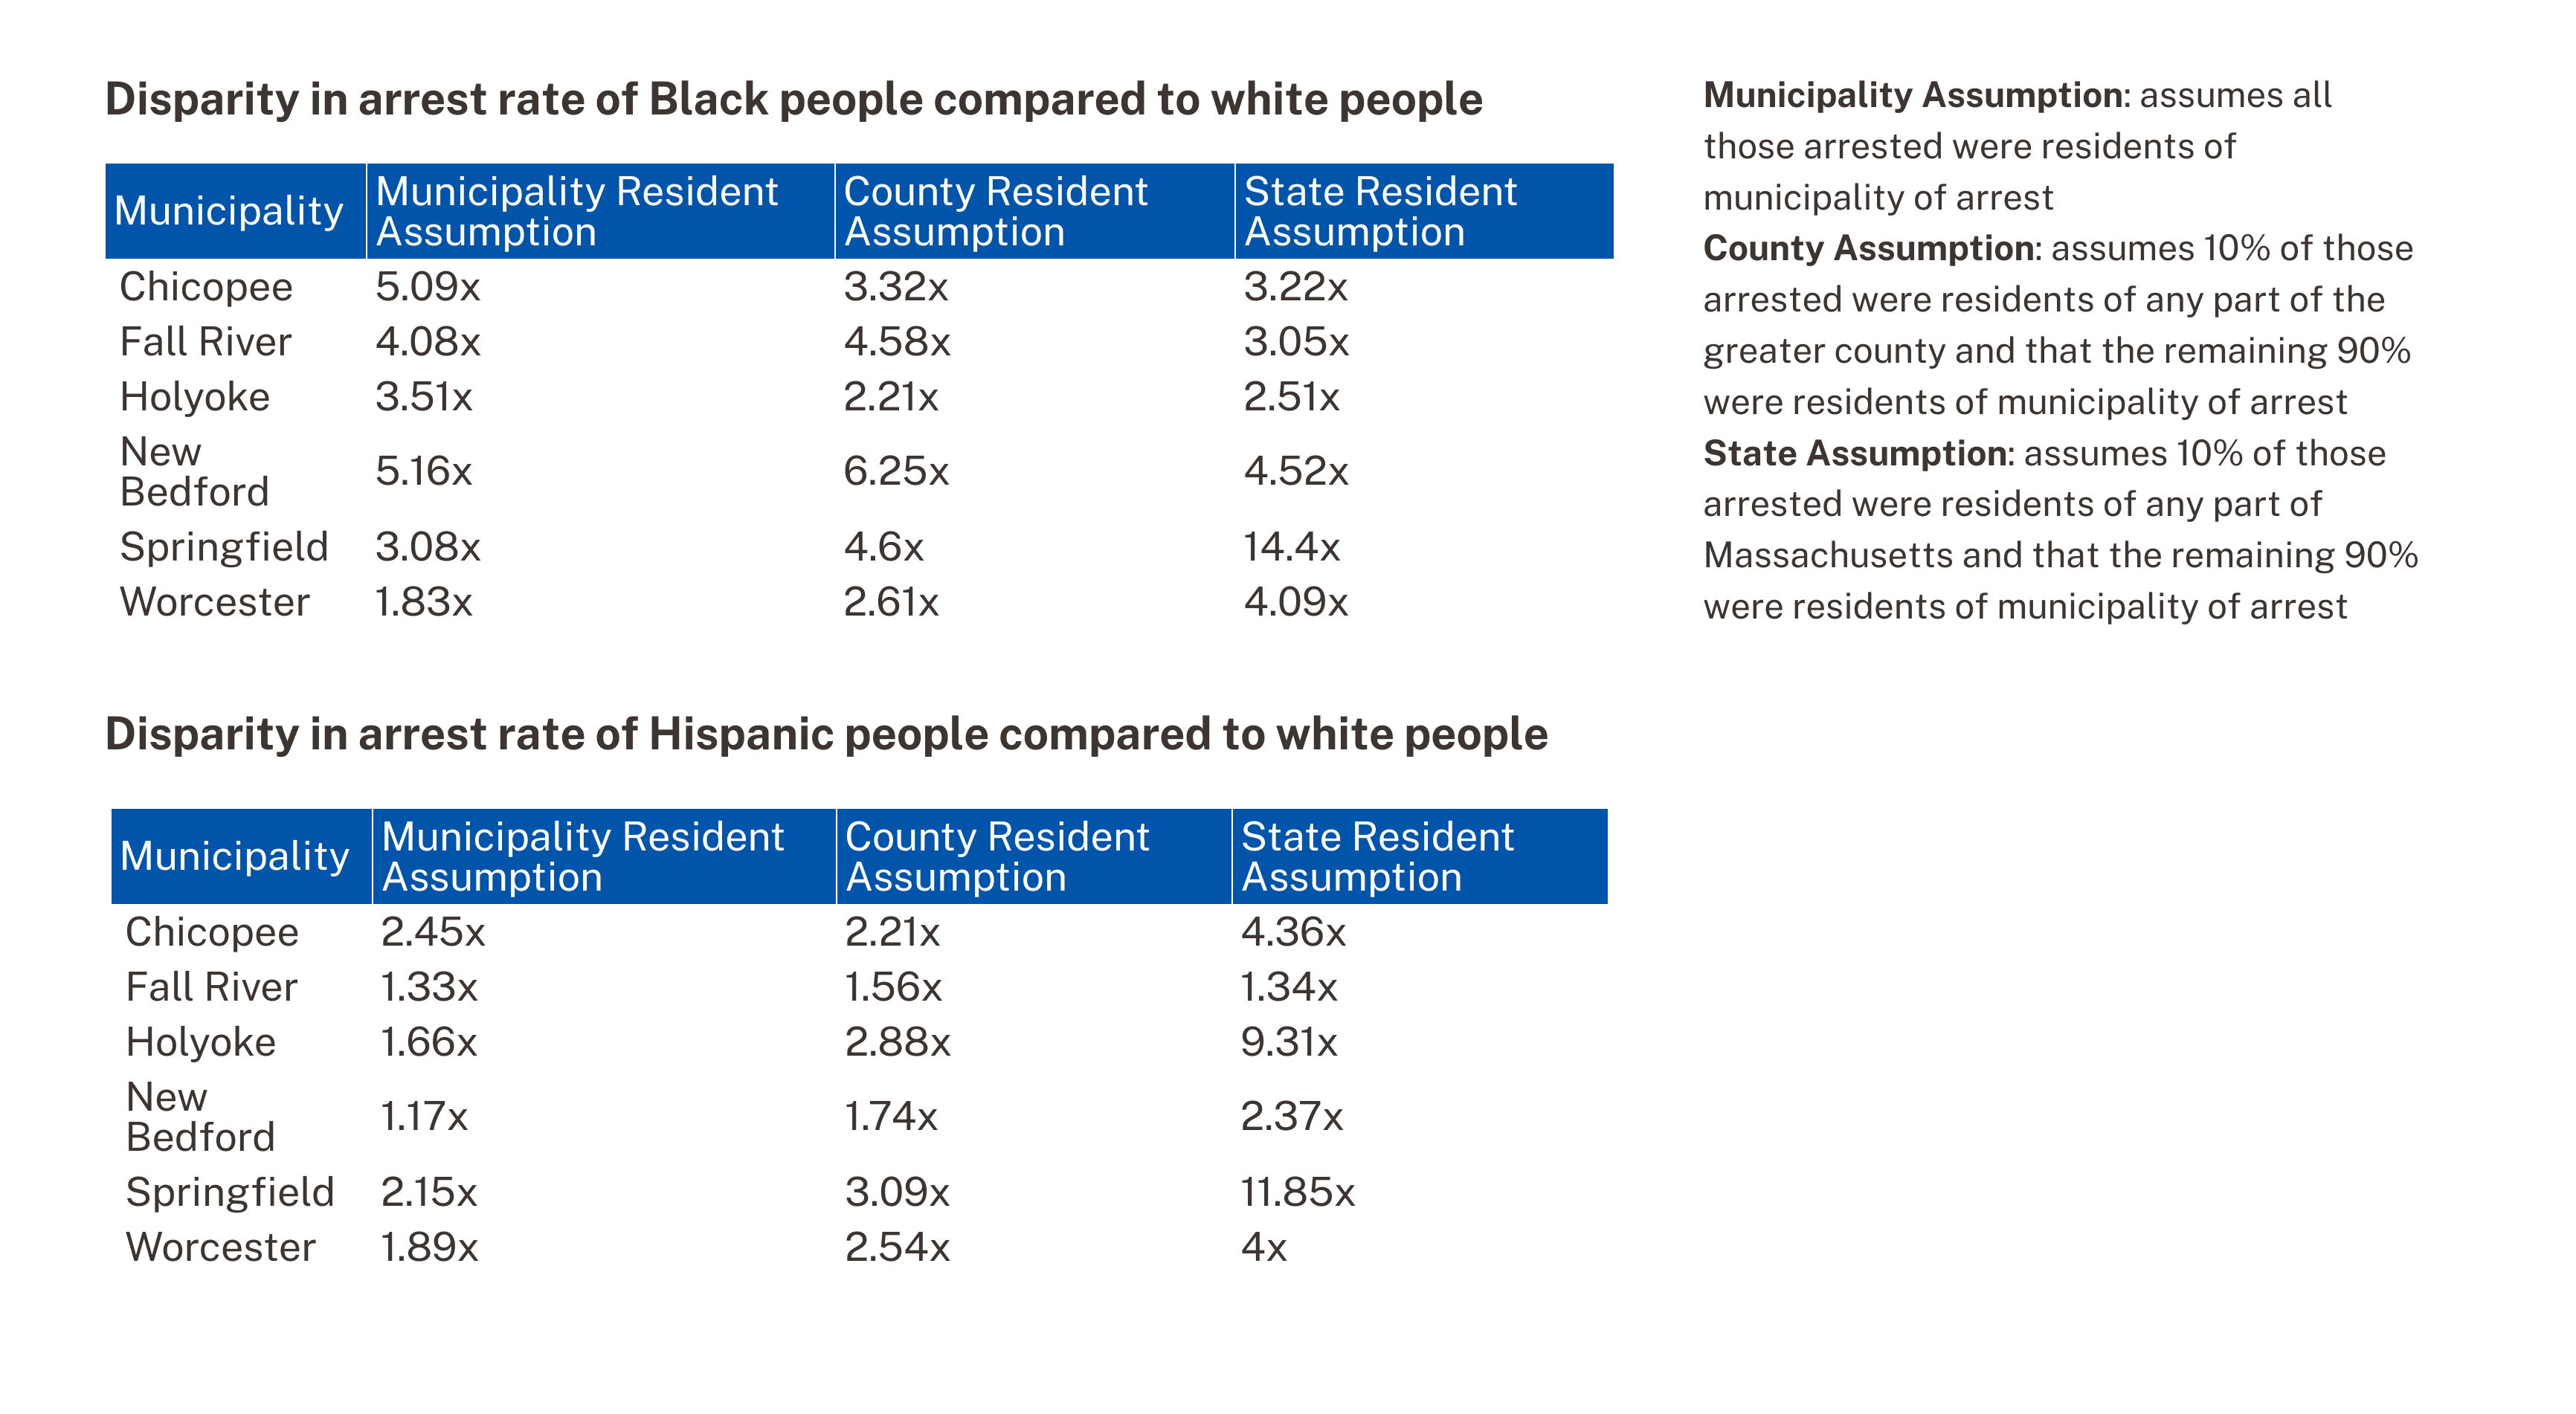
Our analysis suggests there were significant racial disparities in arrest rates across the state in 2020. After a statewide review of the data, our team identified six cities with unusually high rates of arrest and focused on these communities for more in-depth analysis. When compared to the resident population in the six cities analyzed—Fall River, Chicopee, Holyoke, New Bedford, Springfield, and Worcester—Black and Hispanic people were arrested at a much higher rate than white people.
Of these six cities, New Bedford had the highest arrest rate disparity for Black people; Black people were arrested at 5.2x the rate of white people when compared to share of resident population. The disparity for Hispanic people was highest in Chicopee where Hispanic people were arrested at 2.5x the rate of white people. A statewide comparison shows the same concerning pattern. Across the state in 2020, Black people were arrested at 2.9x the rate of white people, and Hispanic people were arrested at 2x the rate of white people.
There are some limitations in the data provided by the state. For example, the data do not indicate whether those arrested were residents of the municipality where police made the arrests.1 Nonetheless, comparison of the share of arrests by race to the overall resident population still provides a valuable way to identify potential disparities. Furthermore, the indications of racial disparity are consistent with other reports, such as a 2021 analysis of the same Massachusetts state arrests dataset by NBC10 Boston and students from Boston University’s Justice Media Computational Journalism co-lab. The stark disparities in arrest rates indicated here are considerable and call for continued attention and action.
We can’t manage what we don’t measure. The reporting of arrest data mandated by the 2018 criminal law reform allows us to identify racial disparities in arrests in communities statewide. But analyzing the data is only the first step. Cities and towns need to take a close look at their policies, procedures, and police management to understand why these disparities are occurring, and take corrective action to address them.
Data analysis was conducted by Boston University students including Nikoloz Rapava, Sheila Yee, Natalia Clark, and Xi Li under the supervision of the BU Spark! Program based at the BU Faculty of Computing & Data Sciences and led by Ziba Cranmer (BU) with project management support from Della Lin (Project Manager). This work was done in collaboration with ACLUM.
1 Since the data do not indicate whether or not the arrestee was a resident of the location where they were arrested, the analysis was tested under the case that some portion of arrestees resided in a different part of the state. Even with this modification, Black and Hispanic people were arrested at a much higher rate than white people.
Below is the analysis of arrest rates disparities for Black and Hispanic people assuming 10% of those arrested were residents of any part of the greater county or state.
Eyes in the Sky: Data Reveal Which Mass. Government Agencies Use Drones
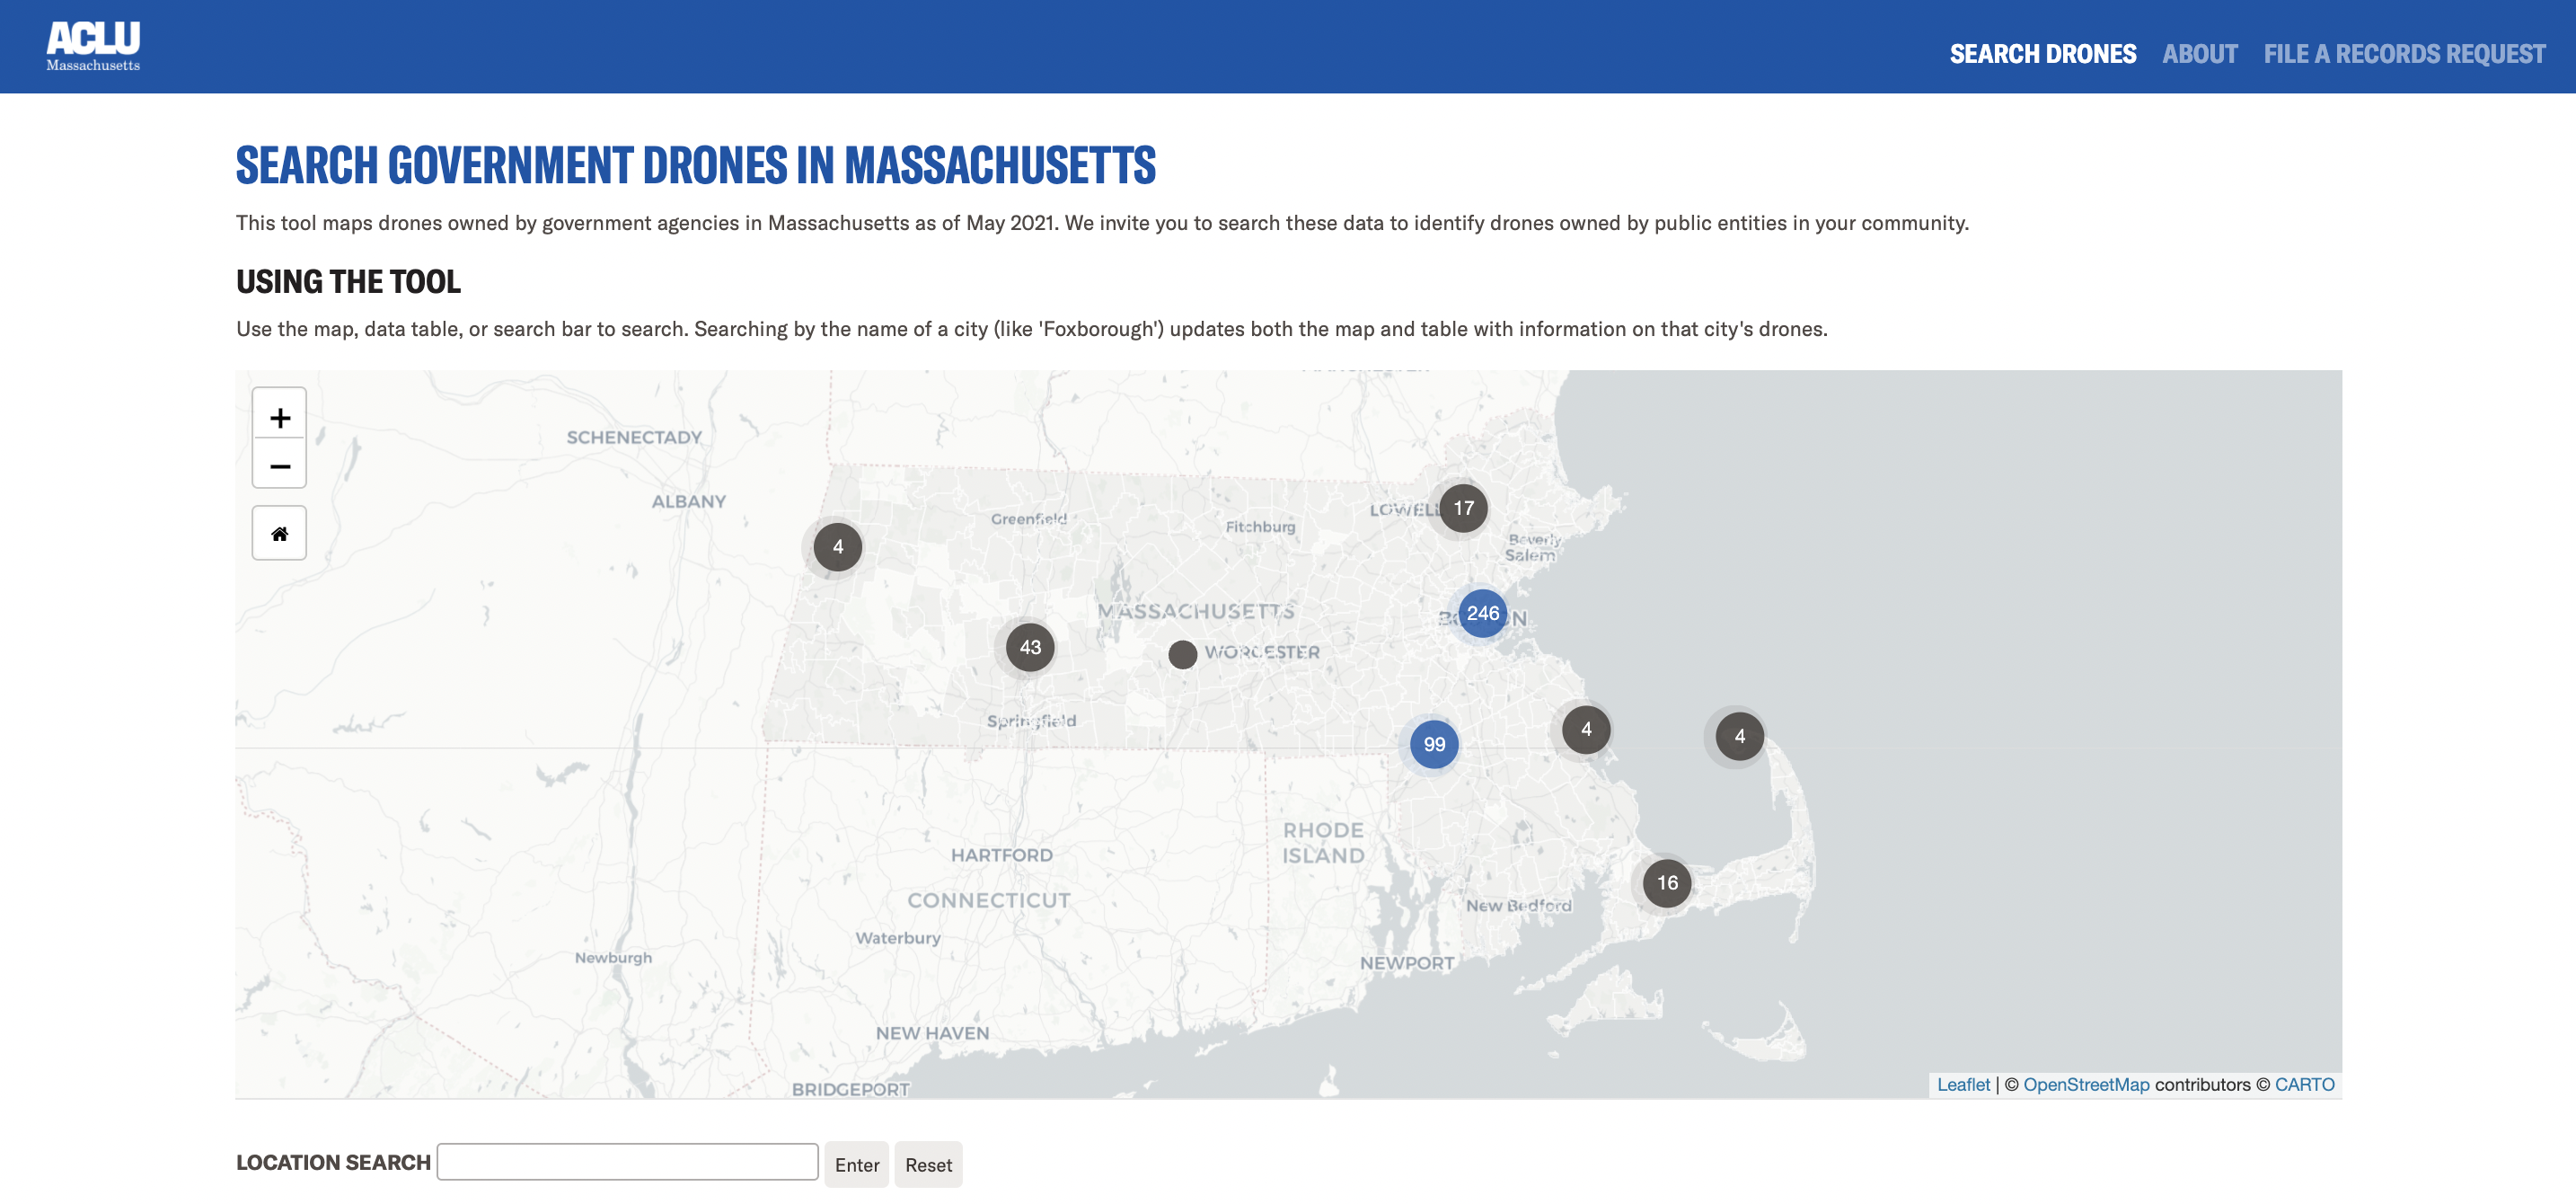
Today, the ACLU of Massachusetts published new data on drones owned and operated by government agencies in Massachusetts. The dataset includes 431 drones (a.k.a. unmanned aircraft systems) along with their model types, physical locations, and agency ownership. The ACLU has created an interactive tool so anyone can explore the dataset and identify drones owned by public entities in their own communities.
Search Government Drones in Massachusetts
Public records request to the Federal Aviation Administration
The Federal Aviation Administration (FAA) oversees licensing for drones and unmanned aircraft systems nationwide. Before an agency can fly a drone, the device must be registered with the FAA. The FAA’s role in licensing drones makes it relatively easy to determine which government agencies are using them. Instead of filing hundreds of records requests with government agencies across the state, we only had to file one federal Freedom of Information Act (FOIA) request. So, in May 2021, that’s what we did. The data we obtained include drones owned by local and state law enforcement, as well as those owned and operated by other government agencies, like public universities and transportation entities.
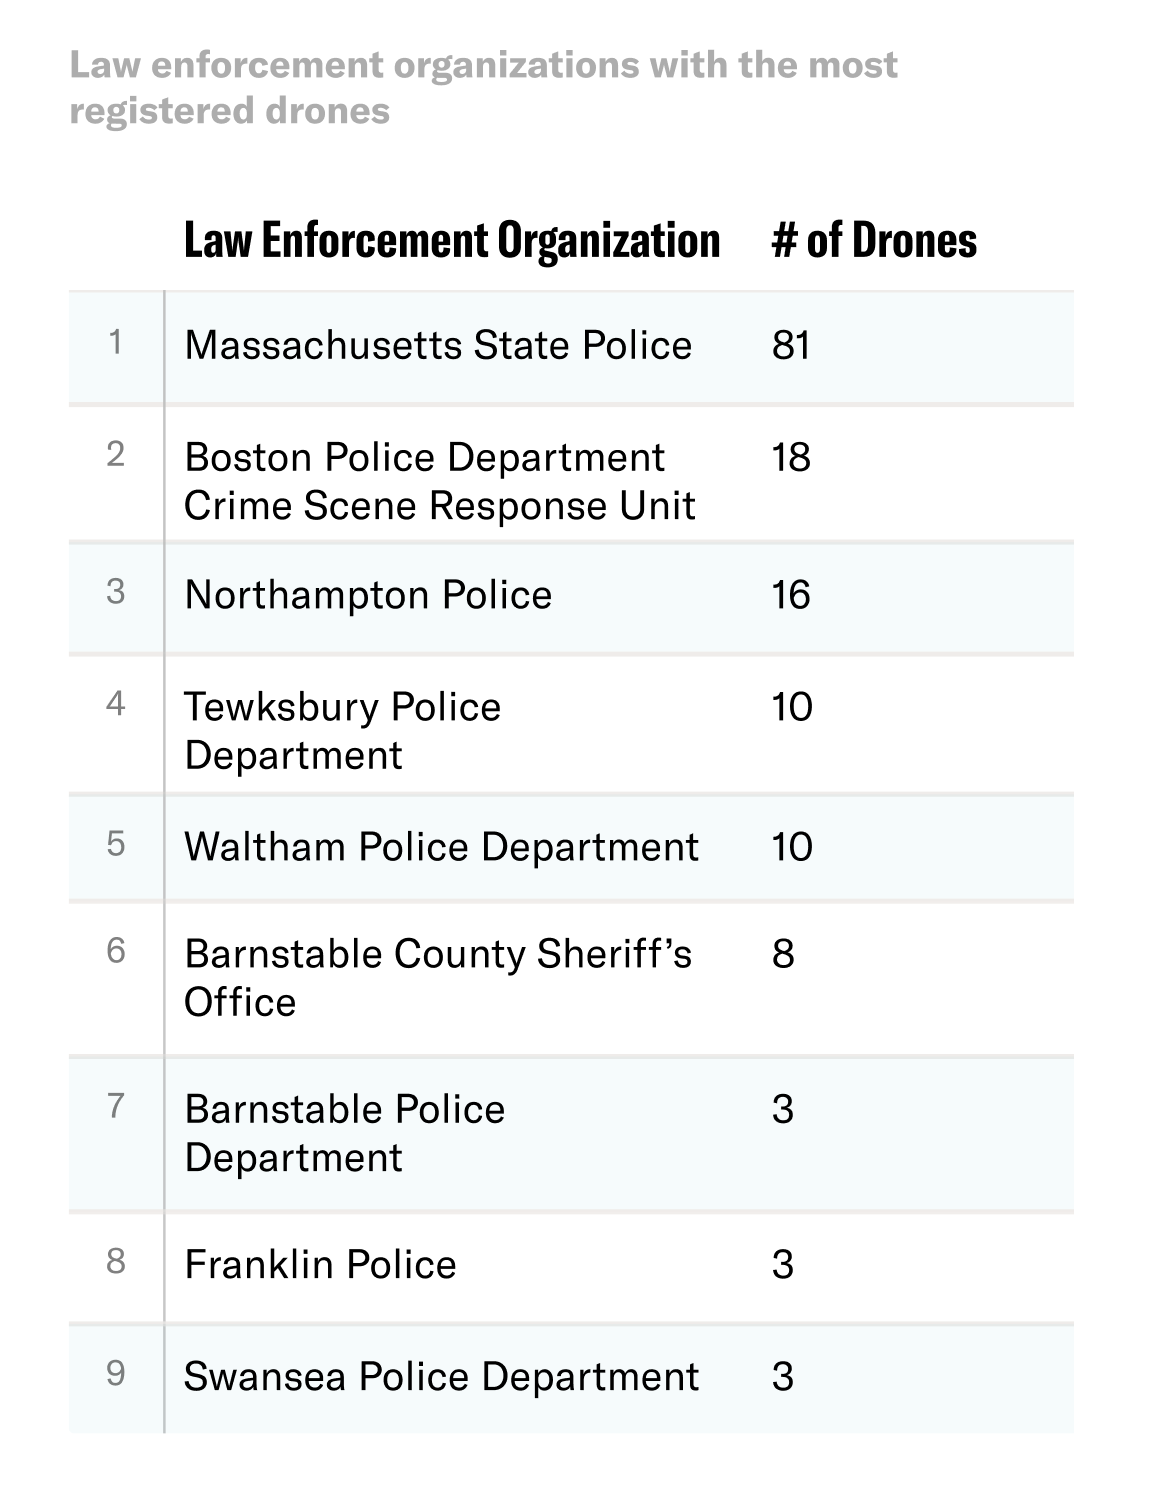
Significant number of drones owned by law enforcement
The data show that Massachusetts police departments own a significant number of drones, with law enforcement drones making up nearly half (42 percent) of all those registered to government agencies in the state. The policing organizations with the greatest number of drones are the Massachusetts State Police, with 81 registered devices, and the Boston Police Department Crime Scene Response Unit, with 18.
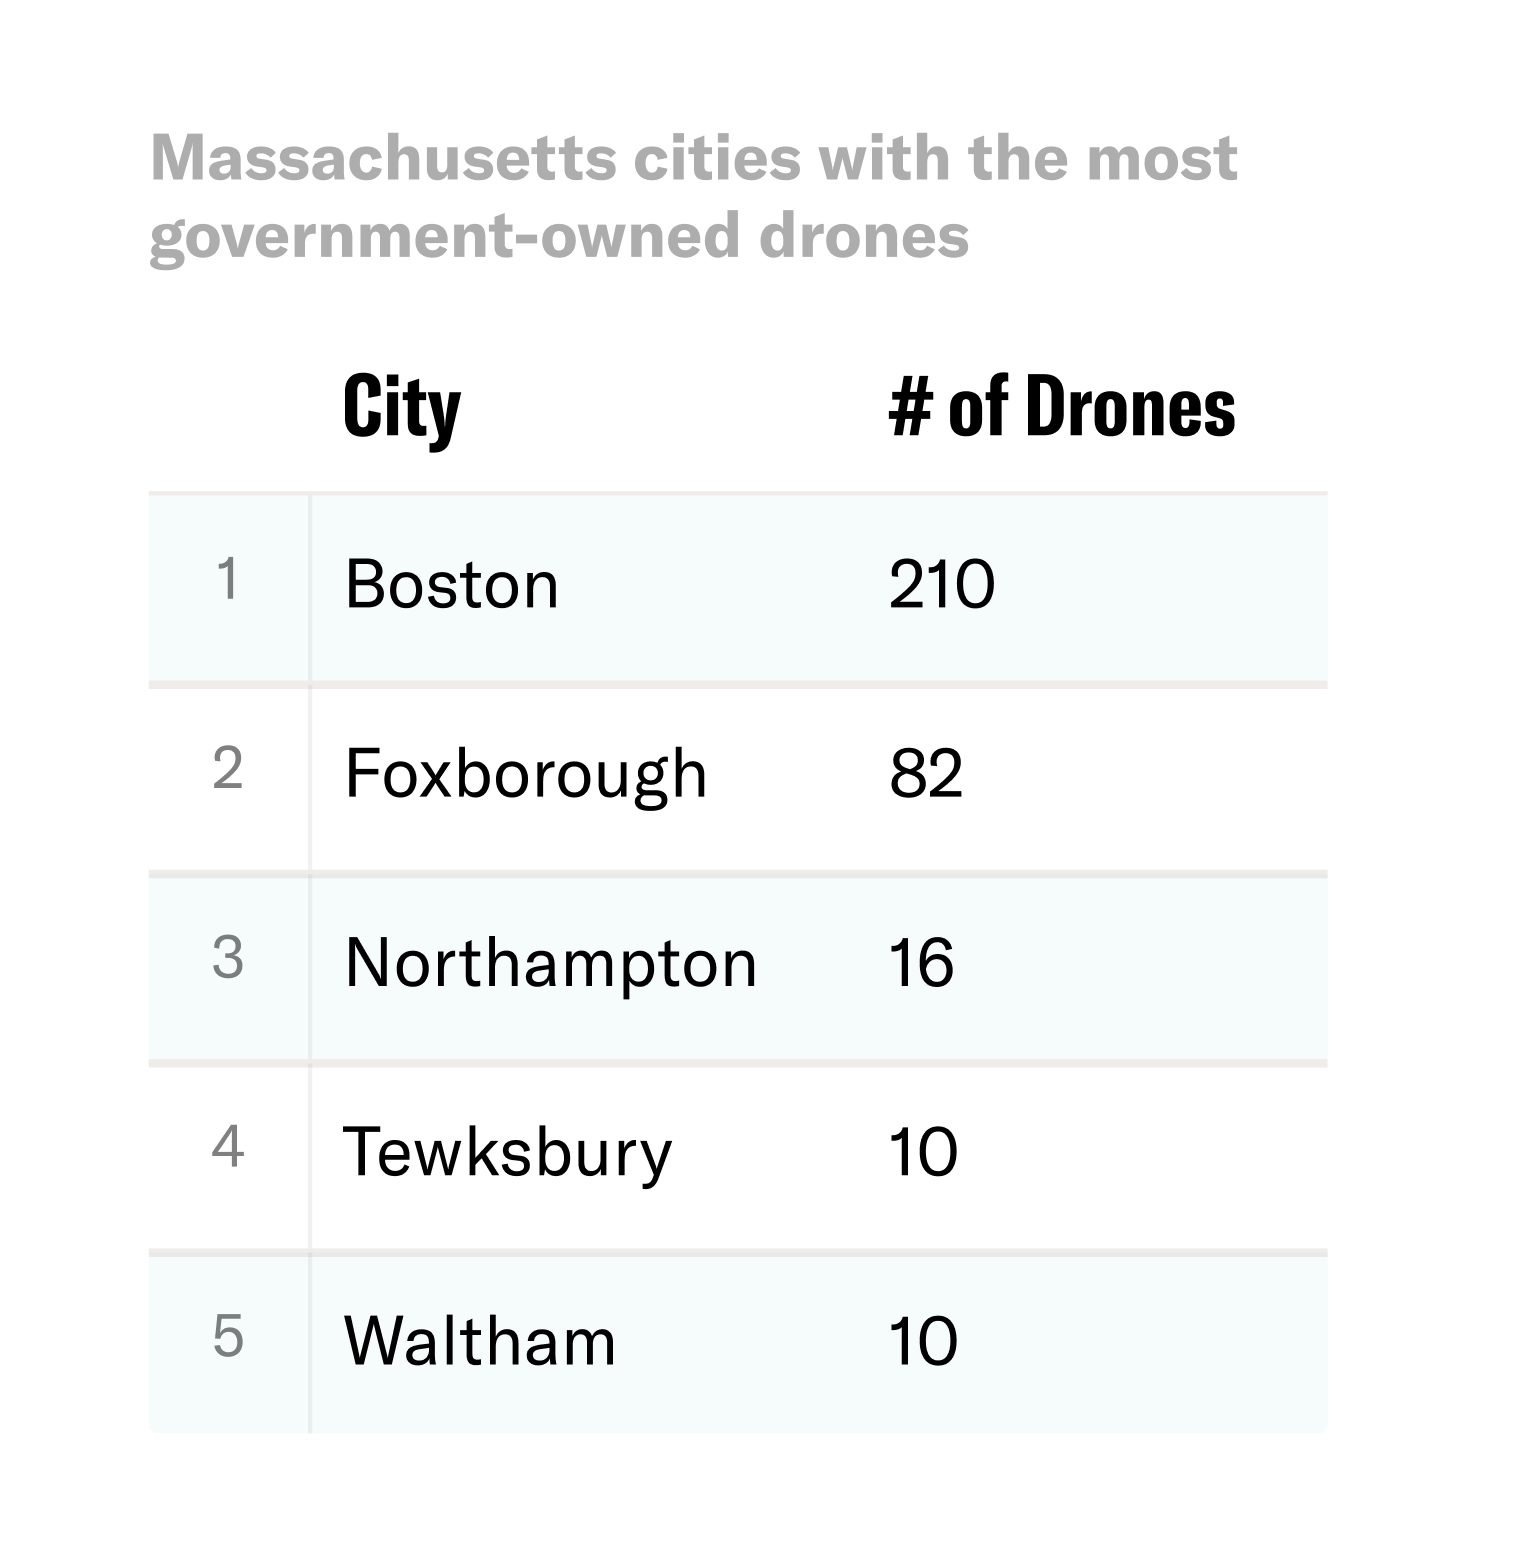
High concentration of government drones in Boston and Foxborough
According to the data, there are 210 government-owned drones in Boston, the highest number of any MA city and almost half of all government-owned drones in the state. Most of these drones—189—are registered in East Boston and owned by the Massachusetts Department of Transportation’s Aeronautics Division.
Foxborough has the second-highest number of government-owned drones. All but one of the 82 drones registered there are owned and operated by the Massachusetts State Police.
Controversy with popular drone manufacturer
The most common drone model found in this dataset is DJI’s Phantom 4, with a total of 47 units owned by Massachusetts government organizations. While the data do not include specifics about any model’s capabilities or features, DJI advertises that the Phantom 4 has a max flight time of 28 minutes, a max speed of 20 m/s, and includes a camera for still photography and video.
DJI is by far the most popular company with Massachusetts government agencies, representing a whopping 85 percent of all drones documented in the dataset. The company’s strong business with Massachusetts government agencies is notable given that the Trump administration Department of Commerce placed it on the Entity List in December 2020, alleging that the company posed national security concerns and enabled human rights abuses.
Other drone companies have likewise faced criticism over human rights. A recent report on drone manufacturer Brinc highlighted a promotional video advertising weaponized patrol drones that could be used to target and assault migrants at the southwest border. A bill currently before the Massachusetts state legislature would prohibit the use of weaponized drones in the state, and would require police to get a warrant before using drones for surveillance in most circumstances.
Learning more about government use of drones in Massachusetts
The dataset published here tells us which entities have drones but does not provide information on how or when those drones are used. If you’re interested in learning about how government agencies in Massachusetts have used drones, you can use our model public records request to find out. More information about this process and resources are available through the tool linked below.
Search Government Drones in Massachusetts
If you find anything interesting, please reach out to us at data4justice@aclum.org and let us know.
MA Voter Cutoff Law Disenfranchises Registered Voters
In the wake of preliminary elections for Boston’s mayoral race, we’ve seen a number of plausible explanations for strikingly low turnout across the city. But there’s one aspect of this puzzle that most commentators seem to have overlooked: Although mail-in ballots and early voting make it easier to cast a vote in Massachusetts, significant barriers remain—and if we’re serious about increasing turnout, we need to clear every needless hurdle on the path to ballot access.
That includes Massachusetts’ voter cutoff law—which actively disenfranchises registered voters.
In Massachusetts, the voter registration deadline for any election is a full 20 days prior to the election date. And for elections like Boston’s preliminary, this deadline is in the dead of August—before the most high-profile events, debates, and election-related activities occur. In fact, the voter cutoff for the Boston preliminary mayoral election was a full two weeks before the first televised debate. In recent presidential elections, thousands of eligible voters have been disenfranchised by this arbitrary voter cutoff. Anybody can find themselves on the wrong side of Massachusetts’ voter registration deadline—including people working multiple jobs, people with disabilities, and renters.
Current voter cutoff impacts residents who move
Indeed, Massachusetts’ voter cutoff is just days before Boston’s traditional September 1 apartment turnover date—meaning new Boston residents may have had to sit this election out entirely. Residents who moved within the city may have had to travel to a different neighborhood or precinct to cast their ballot in their old location, as state law allows voters to vote from a previous address for up to six months after moving. Consider, for example, a resident who moves from East Boston to Mattapan before the election; in the absence of updating their voter registration by the state’s arbitrary deadline, that voter must drive across the city to cast a ballot—or take a combination of train, subway, and buses to their old polling location, spending up to two hours simply getting to the polls. Let’s be clear: For voters who rely on public transit, need childcare, or have strict work schedules, the registration deadline pushes voting out of reach for no good reason.
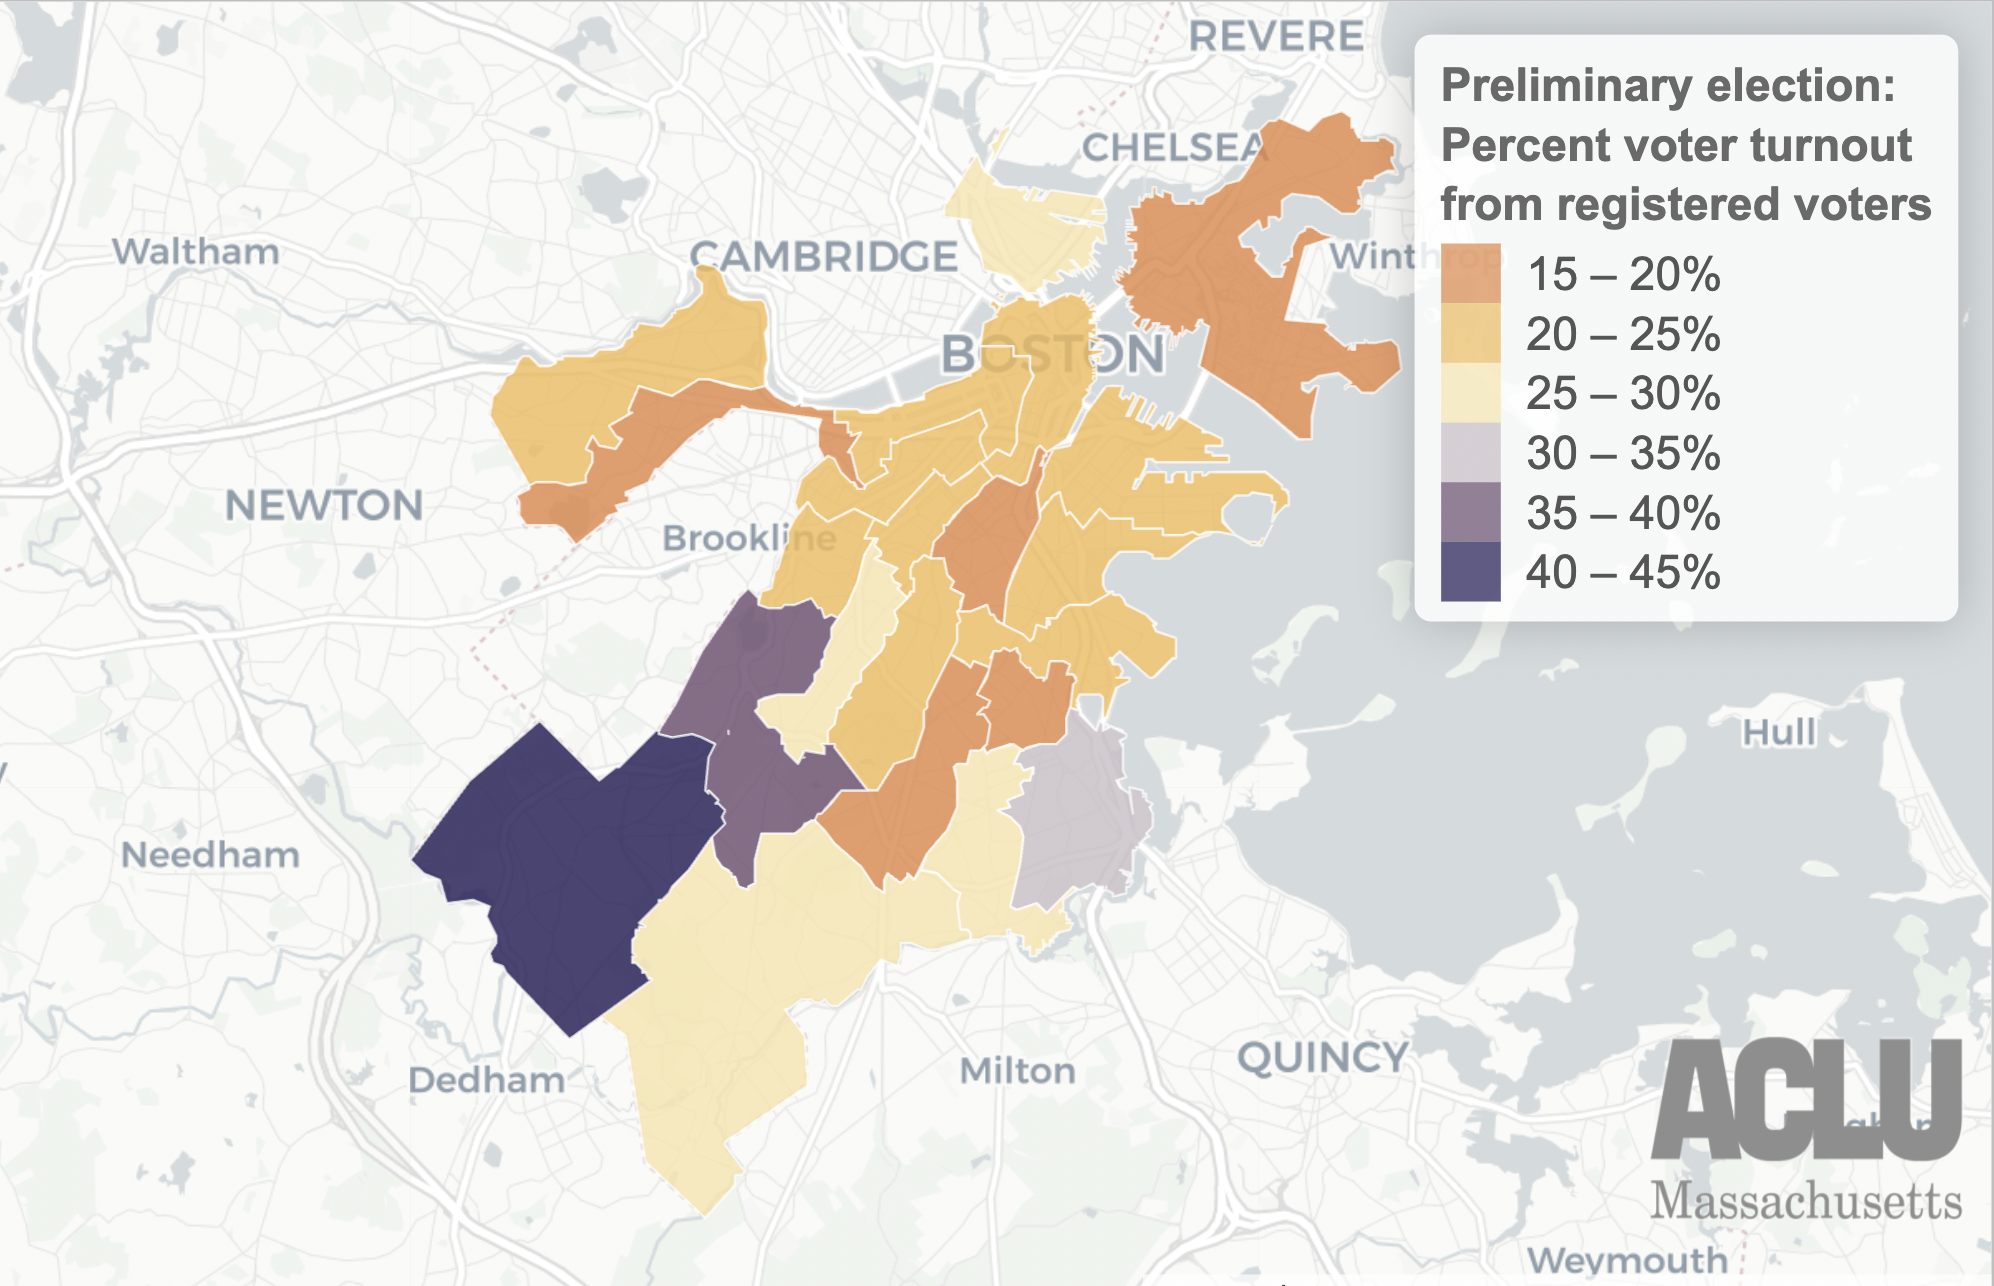
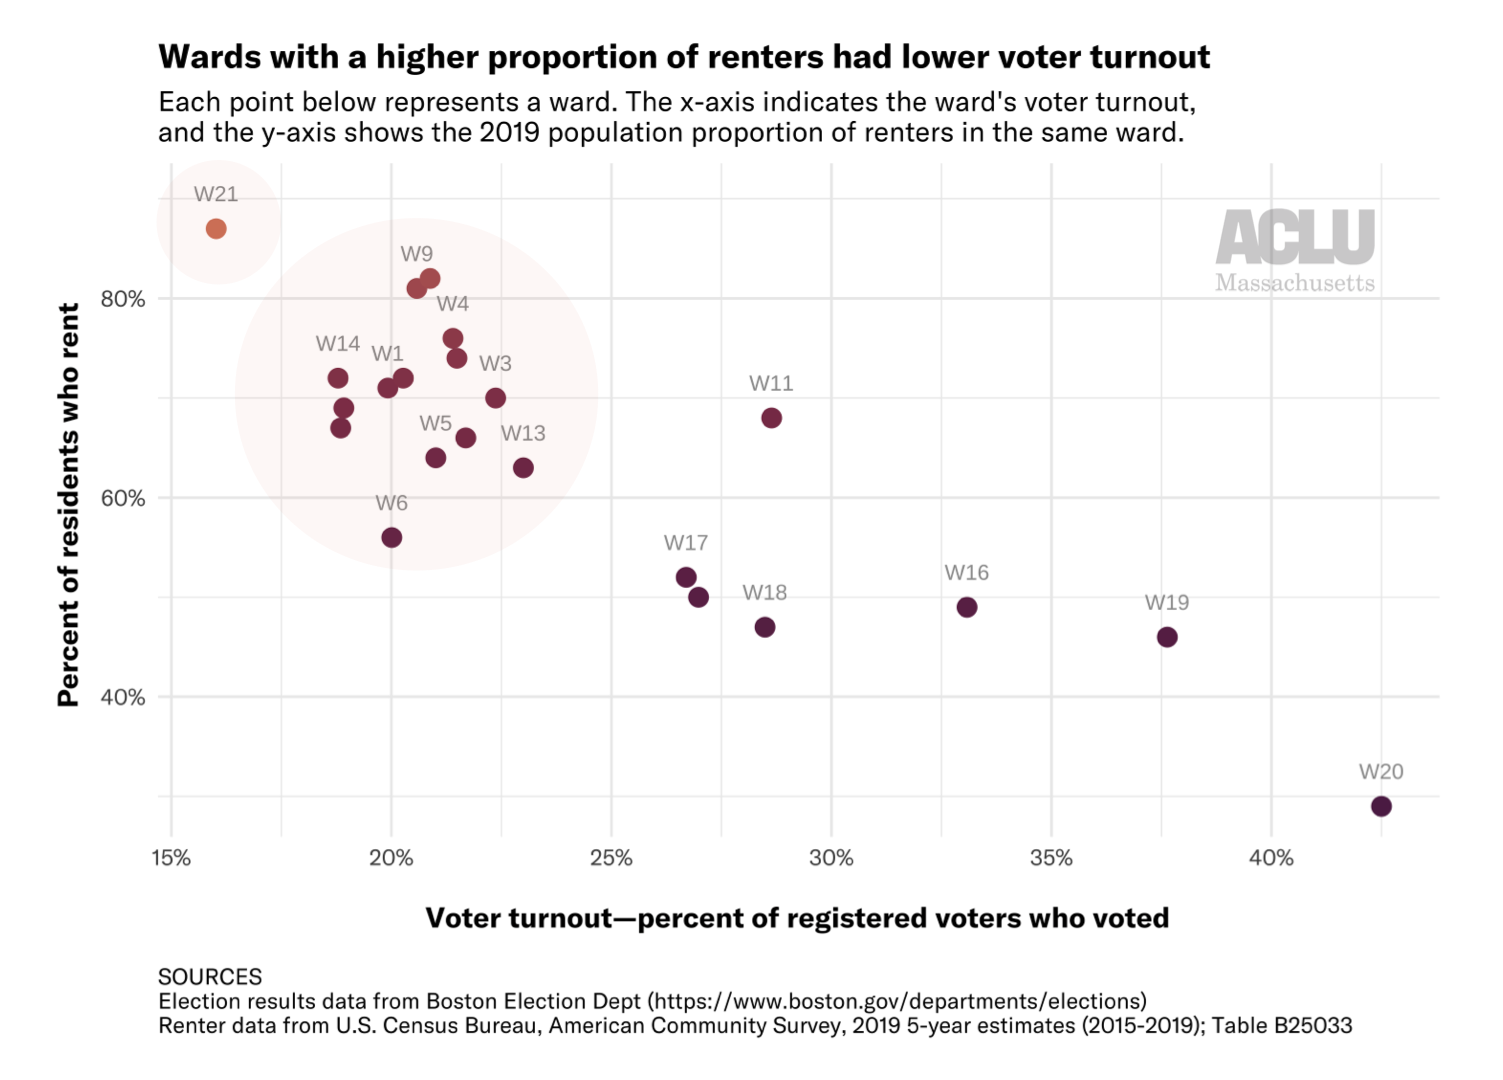
Our team’s analysis shows that the wards with the lowest turnout in this month’s Boston preliminary election also have the greatest proportion of renters. Renters already have lower voting rates than homeowners, for complex reasons we won’t attempt to address here. That’s why the state must do everything in its power to increase those rates, including by passing same day voter registration legislation. Every barrier to voting reduces the likelihood that people will vote, and trends in Boston indicate renters need every push possible to get to the polls on election day.
Lowest voter turnout from areas with more renters
We know that Massachusetts’ voter cutoff law disproportionately impacts populations that often intersect: people of color, young people, and people with lower incomes. These residents move more frequently due to rising rents, may have subpar Internet access, and often face greater pressures in their daily lives that make it substantially more difficult to meet an abstract, arbitrary registration cutoff—or to travel all the way across town on Election Day to cast their ballot in their old neighborhood.
At a time when other states are rolling back voting rights, Massachusetts lawmakers must continue to do everything they can to make voting as inclusive and accessible as possible. Among other provisions, the VOTES Act includes same day registration, which would allow eligible Massachusetts voters to register to vote or update existing registration on Election Day and during the early voting period. The bill is currently pending before legislators; the preliminary election turnout in Boston underscores its urgency.
Low preliminary turnout in Boston on 9/14
Overall, wards with a higher proportion of renters had lower voter turnout. The maps below compare voter turnout in the Sept 2021 preliminary municipal election with the estimated share of renters in each ward (based on 2019 data). In these maps, percent voter turnout refers to the number of people who voted out of the number of registered voters.
SOURCES: Election results data from Boston Election Dept (https://www.boston.gov/departments/elections). | Renter data from U.S. Census Bureau, American Community Survey, 2019 5-year estimates (2015-2019); Table B25033. | Voting age population data from U.S. Census Bureau, Decennial Census, 2020: DEC Redistricting Data (PL 94-171); Table P3″. | Ward boundaries from Analyze Boston (https://data.boston.gov/dataset/wards)
DATA ANALYSIS : ACLU of Massachusetts
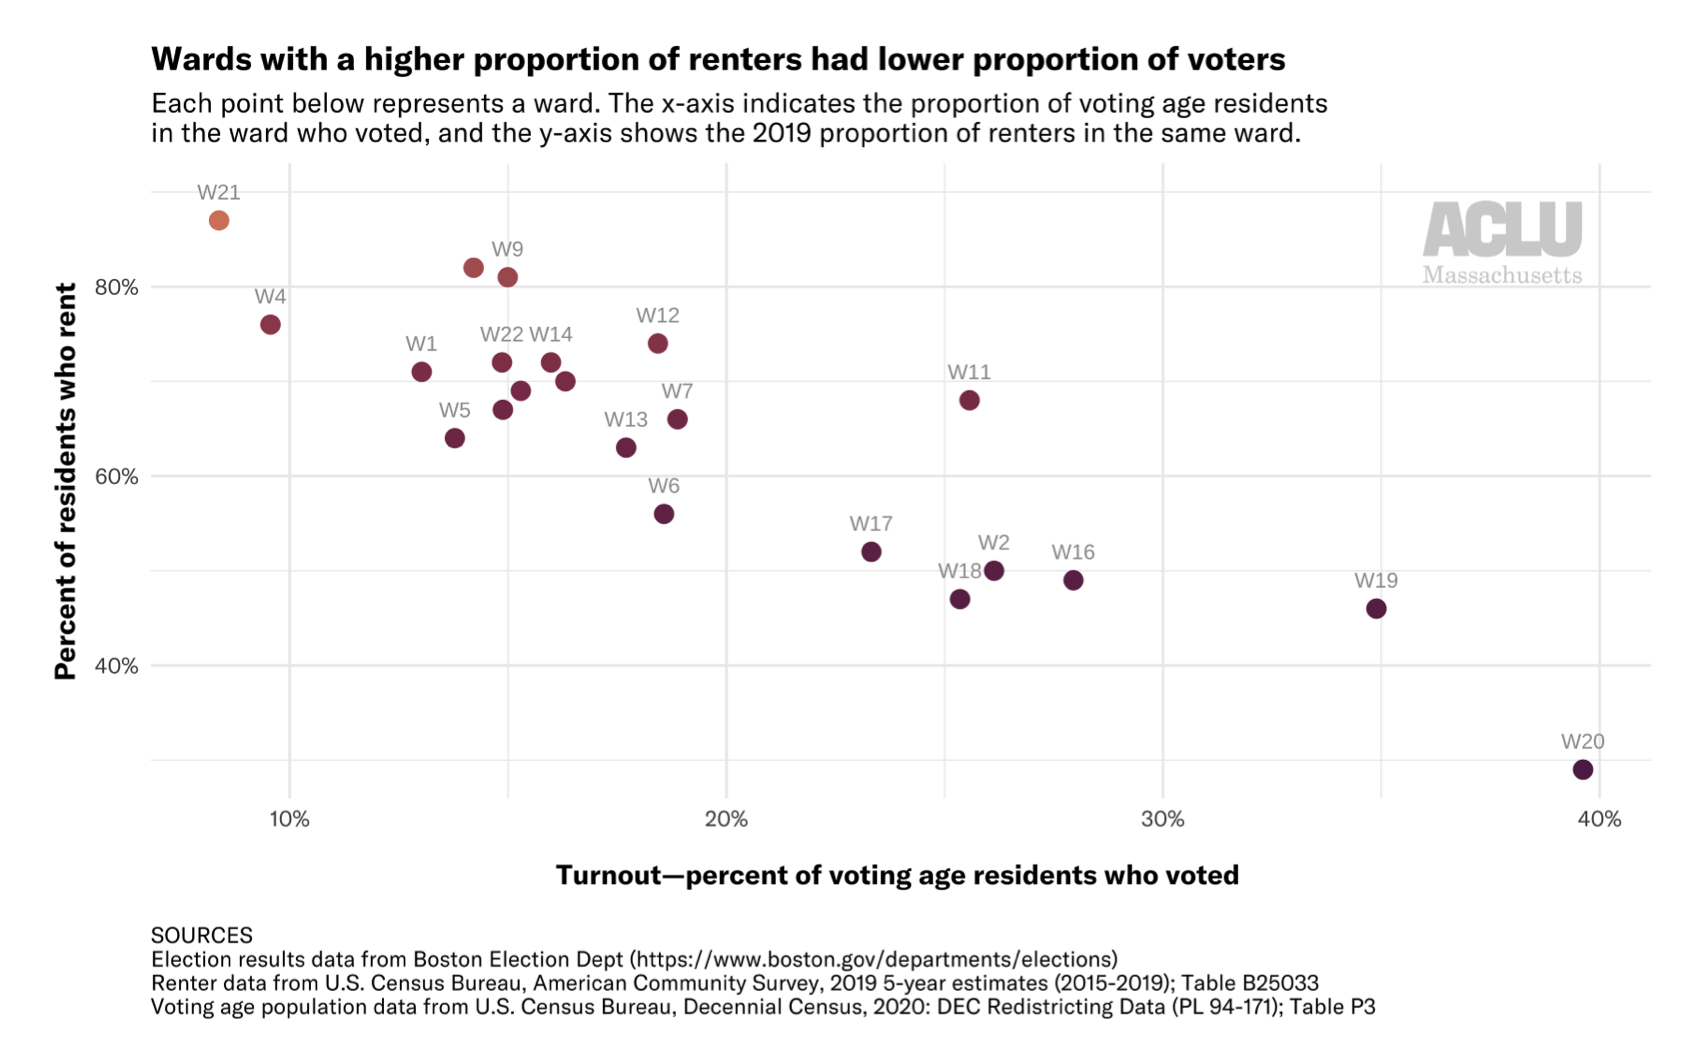
Overall, wards with a higher proportion of renters had lower voter turnout. The maps below compare voter turnout in the Sept 2021 preliminary municipal election with the estimated share of renters in each ward (based on 2019 data). In these maps, percent voter turnout refers to the number of people who voted out of the ward’s adult (18+) population.
SOURCES: Election results data from Boston Election Dept (https://www.boston.gov/departments/elections). | Renter data from U.S. Census Bureau, American Community Survey, 2019 5-year estimates (2015-2019); Table B25033. | Voting age population data from U.S. Census Bureau, Decennial Census, 2020: DEC Redistricting Data (PL 94-171); Table P3″. | Ward boundaries from Analyze Boston (https://data.boston.gov/dataset/wards)
DATA ANALYSIS : ACLU of Massachusetts
Governor Baker recently said he opposes same day registration because of “the complexity associated with it.” But the truth is, Massachusetts’ voter cutoff law makes accessing the ballot too complex for tens of thousands of people—and same day registration is a simple solution. Same day registration was first implemented in the United States in 1973—nearly 50 years ago. Since then, 20 other states and Washington, D.C. have implemented same day registration. Those states, including our neighbors in Connecticut, New Hampshire, Maine, and Vermont, report fewer burdens on local election officials and improved voter turnout.
The very communities harmed by Massachusetts’ voter cutoff law would benefit from same day registration. A recent University of Massachusetts study found that same day registration often creates higher turnout among Black and Latinx voters. Other researchers estimate that same day registration could increase turnout for those who have moved in the last six months by nearly 8 percent. And same day registration eases burdens for young adults and elderly populations alike.
Our democracy works best when all qualified voters are able to participate fully—and that simply is not the case in Massachusetts today. Low voter turnout is always cause for concern, and there are likely many factors that play into it—but there’s no excuse to maintain a law that makes it harder for voters to cast their ballot. It’s past time to enact same day registration in Massachusetts.
A Mayor’s Roadmap to Curb Boston Police Overtime
New to Data for Justice? Get caught up with our 2020 report on the Boston Police budget and other work on policing in Massachusetts.
Boston’s Acting Mayor Kim Janey just this week proposed a new budget for the coming fiscal year: one which maintains a slightly reduced allocation for police overtime. But as we look to the future of policing budgets, we still have much to learn from the past.
Last June, facing monumental pressure from local advocates and community members, the Boston City Council approved a City budget that “cut” the Boston Police Department’s gargantuan overtime allowance by 20 percent – from $60 million to $48 million. Not even a year later, that “cut” has been exposed as an empty promise.
On March 12, the Boston City council held its third quarterly hearing to follow up on how the BPD is reducing overtime costs. The update was bleak: just eight months into fiscal year 2021 (FY21), data show the BPD has already blown through almost the entirety of its $48 million overtime budget – setting itself up to finish out the fiscal year $20 million over budget.
This debacle has made one thing quite clear: when it comes to reining in police spending in Boston, the budget as defined by the City Council is effectively irrelevant. This is due to both (1) a century-old exception in the City Charter that writes the Police Department a blank check, and (2) the fact that many aspects of policing policy are tied up within police union contracts. So who is it that holds the power to actually affect change? TL;DR: it’s the mayor.
In a new analysis, the ACLU of Massachusetts dives deeper into the issue of overtime within the Boston Police Department and how the Mayor of Boston might be able to finally address it. We set out to answer the following questions:
- Just how big is the BPD’s FY21 overtime overage?
- Why does the City let police overtime spending go over budget at all?
- What factors contribute to overtime spending?
- How can we actually fix it?
Access and share this blog published in the form of a report here.
Just how big is the BPD’s FY21 overtime overage?
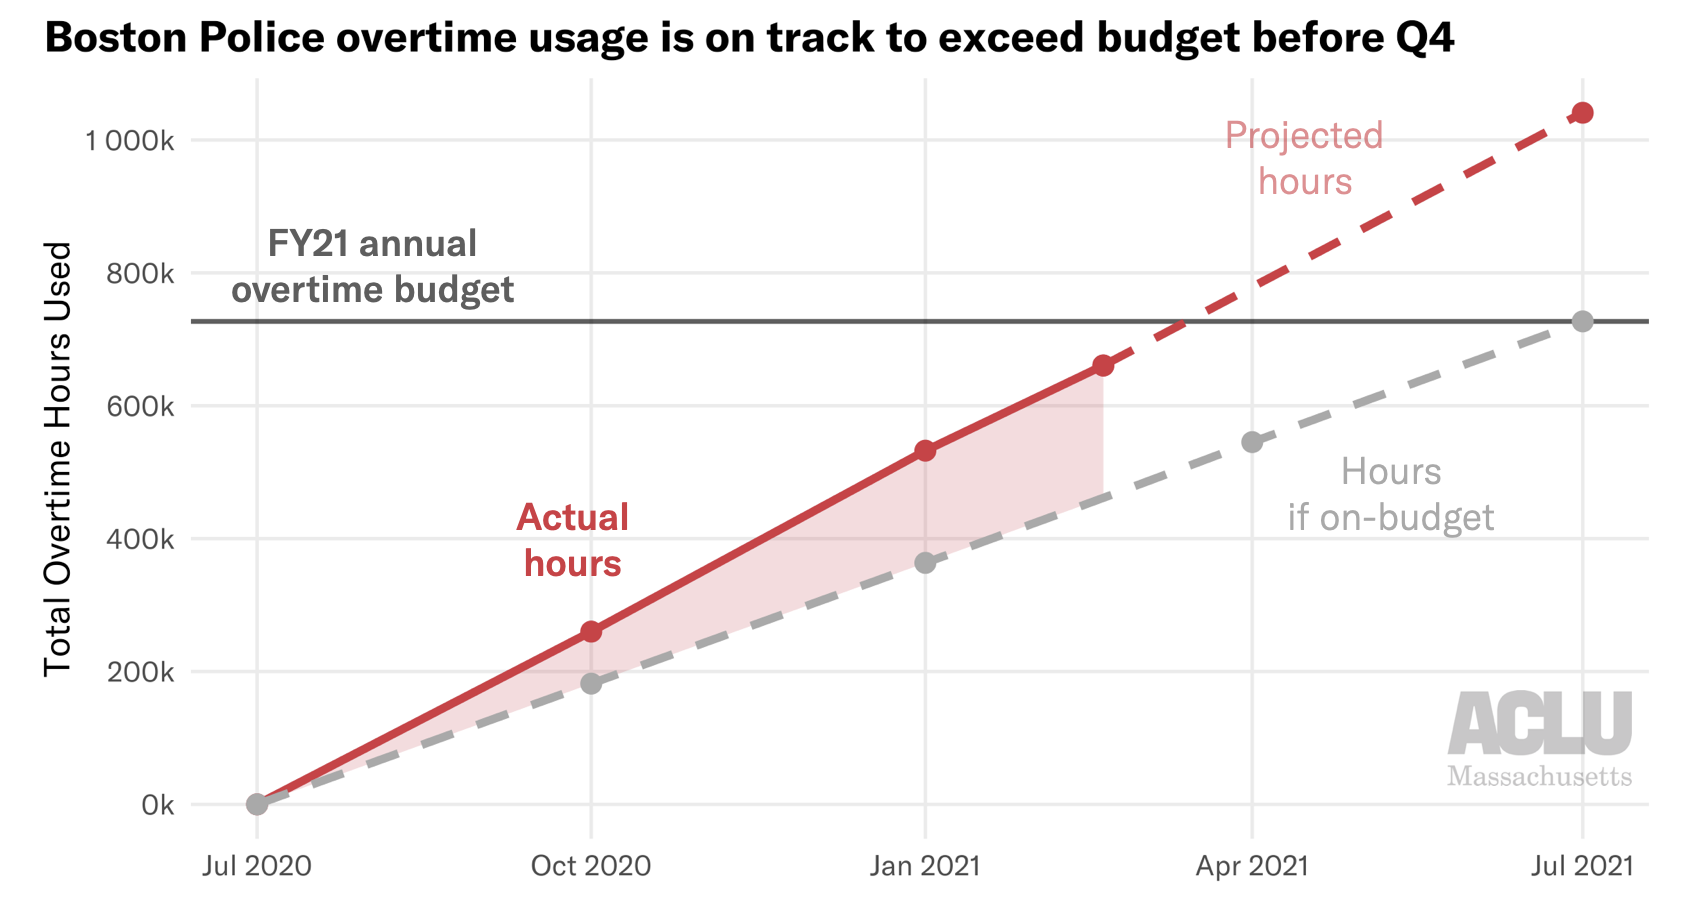
Since we are only three quarters of the way through FY21 (the fiscal year in Boston goes from July 1 through June 30), we can’t know how much the BPD will ultimately go over their overtime budget. However, current projections show an extreme overage, to the tune of more than 300,000 hours.

Indeed, if the current rate of overtime usage continues through the end of FY21, BPD will close out the year with a whopping 1 million overtime hours – 30 percent above the budgeted 727,000 hours. With an hourly overtime rate of approximately 66 dollars an hour, that overage translates to about $20 million of unbudgeted spending that the City will have to cough up. (The BPD itself predicts an overage of $15 million, but that would require a decrease in the rate of OT usage over the next three months – an unlikely outcome.)
It’s hard to overstate how far these taxpayer dollars could go if they were put elsewhere. The projected $20 million excess is about half of the FY21 budget for the Library Department and is 8 times larger than the entire FY21 budget for the Office of Health & Human Services. Actually, the projected $20 million excess is larger than the FY21 budgets of the following 10 City departments combined:
- Veterans’ Engagement ($4.6 million)
- Neighborhood Services ($4.1 million)
- Environment ($3.2 million)
- Health & Human Services ($2.4 million)
- Arts & Culture ($2.2 million)
- Immigrant Advancement ($1.1 million)
- Human Rights ($500,000)
- Women’s Advancement ($460,000)
- Fair Housing & Equity ($320,000)
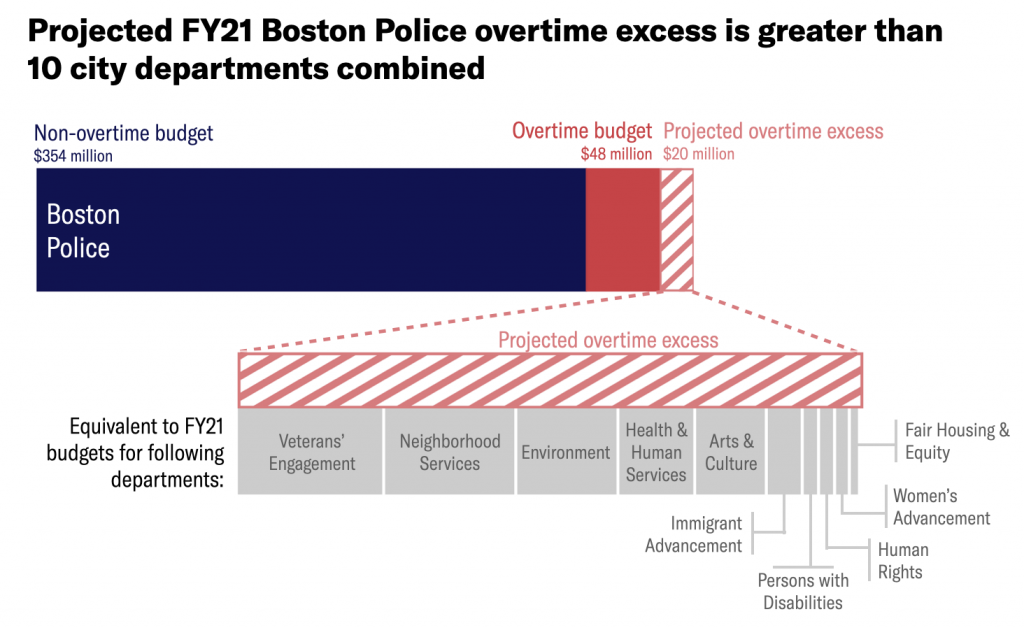
These numbers make it clear that the Boston Police Department is a budgetary parasite, aggressively hoarding taxpayer funds that are sorely needed by other City offices that provide support to communities.
So, how is it that the police are allowed to go over their budget so egregiously?
Why does the City let police overtime spending go over budget at all?
Historically, the Police Department has seen by far the largest overtime overages of any City department. In FY19, for instance, overtime spending went $10.4 million over budget. No other department came close:
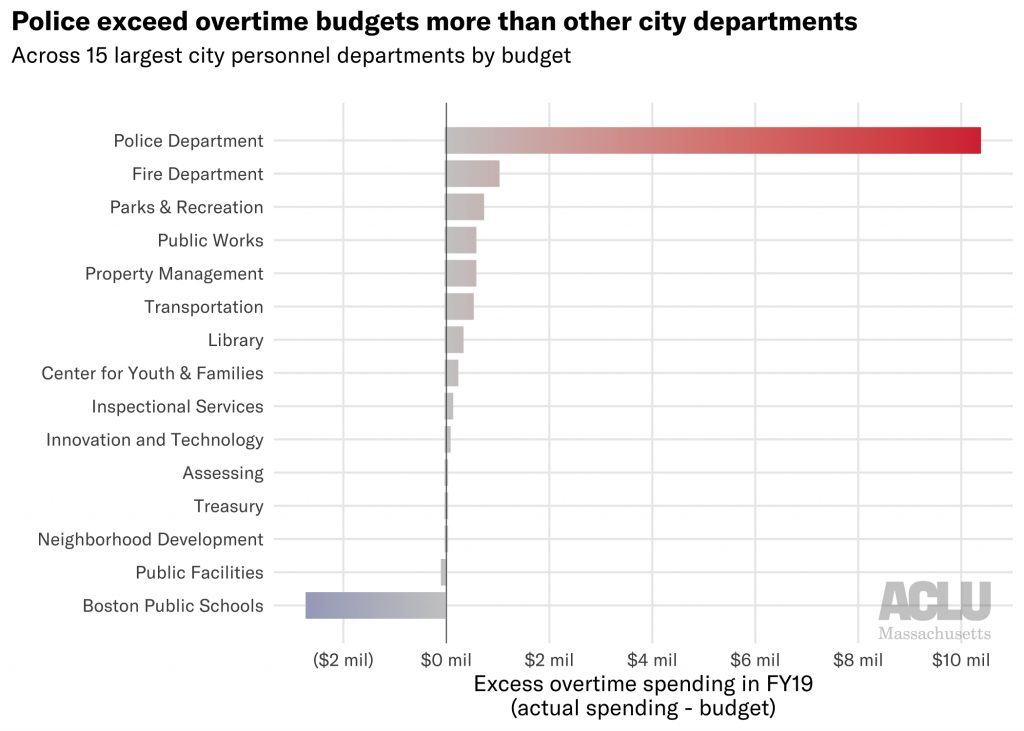
And in comparison, the largest City department, Boston Public Schools, actually spent $2.7 million less on overtime than they were budgeted in FY19.
The City allows police overtime overages to happen because of a vague exception carved out of the City Charter, first included in 1909 and later amended in 1982. It states:
No official of said city, except in case of extreme emergency involving the health or safety of the people or their property, shall expend intentionally in any fiscal year any sum in excess of the appropriations duly made in accordance with law (Boston City Charter, section 42, emphasis added)
In practice this clause is interpreted by the City to mean, as stated by the Boston Municipal Research Board in their 2014 report, that “Police and Fire Department spending for emergency situations, snow removal costs and Execution of Court expenses from court decisions are legally allowed to exceed their appropriations.” No matter that Section 42 does not explicitly mention the Police Department.
Curiously, the above language could suggest that City offices which address public health crises, including COVID-19 and systemic racism, are also allowed to spend in excess of their budgets – but this is not how the Charter has historically been interpreted.
Effectively, the City has decided that all policing qualifies as an “extreme emergency,” and as such is not beholden to budgetary appropriations; police can use City funds with wild abandon without the fear of consequence that other departments face.
What factors contribute to overtime spending?
So where are all of these unfettered overtime funds going? Boston Police officers use various different sorts of overtime:
- Extended tours – when officers work longer than their assigned 8-hour shift
- Additional tours/call out – when officers are called in for unexpected additional shifts
- Court – when BPD officers visit a courthouse (dropping off documents, testifying, etc.) outside of their normal shift; results in a minimum 4 hours of overtime pay regardless of visit length
- Special events –when BPD officers establish a presence at specific events (e.g., parades, sporting events, elections) or certain situations (e.g. heavy police presence at Mass & Cass)
- Replacement – when officers sign up for extras shifts to cover officers who are out on sick leave, vacation, etc.
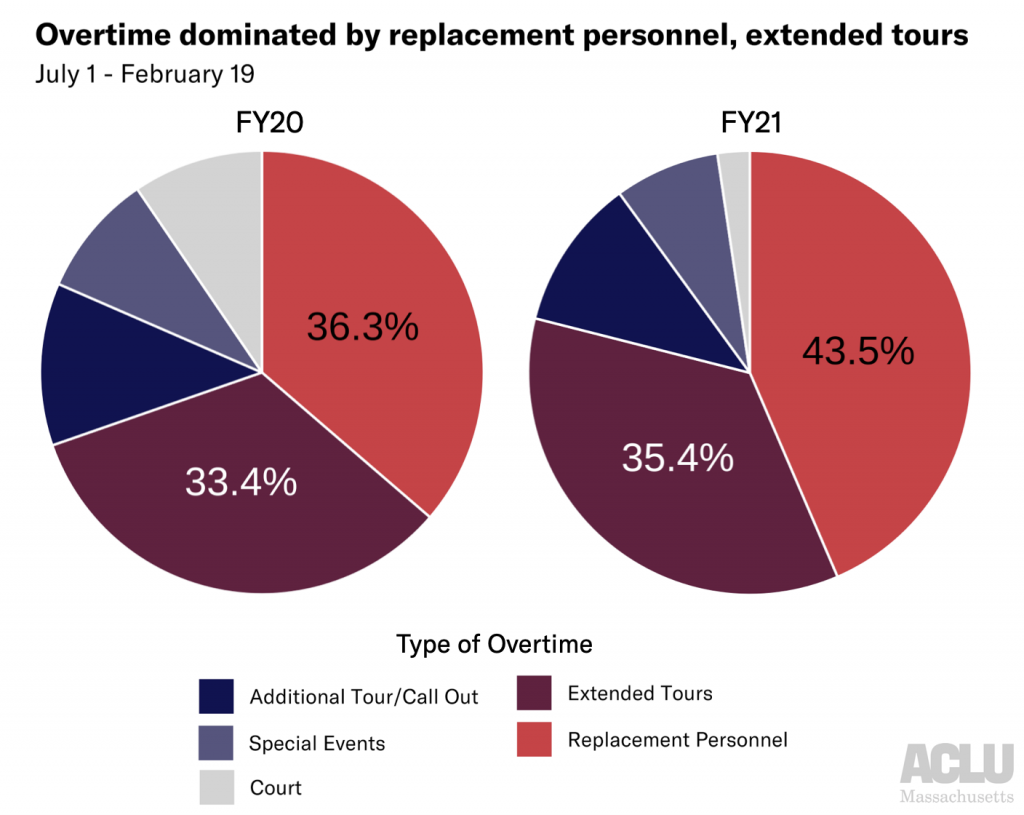
Replacing personnel and extending tours account for the vast majority of overtime hours – over 75 percent so far in FY21. It’s hard to know exactly why this is, as the police have provided multiple reasons including more officers out on sick leave due to COVID, an increase in retirements, and precautions taken around the 2020 election.
But different categories beg the fundamental question: what counts as “overtime”? Why aren’t officers’ schedules arranged such that court visits, annual parades, and longer shifts are included within normal shift scheduling, avoiding costly time-and-a-half overtime pay? Could it be the case that the “minimum staffing” standards that the Department establishes are inflated, requiring more officers than necessary to be on the street, and thus requiring more costly replacement personnel overtime than reasonably required? The BPD has sidestepped questions by the City Council about just these issues.
It's also critical to ask how overtime policing specifically causes harm. Police presence at “special events” has resulted in the cops destroying wheelchairs, running over peaceful protestors (and later bragging about it on camera), and displacing poor and unhoused residents. As long as the City excuses such destructive behavior from the BPD, the cost of police overtime will always be more than just financial.
Careful consideration of such questions helps underscore that the solution to the overtime problem is not hiring more police officers. We aren’t in this overtime mess because Boston has too few cops; we’re in this mess because of toothless budgetary policies, decades of unsupervised policing practices, and an unrestricted power that police wield over their role in the City.
How can we actually fix it?
As the past eight months have exemplified, thanks to the carve-out in the City Charter, any police budget cuts approved by the City Council have no teeth. In addition, many of the policing-related ordinances that the Council is considering this session would be effectively powerless even if passed, because the policies they seek to change are concretized in police union contracts – such as policies defining shift scheduling, discipline, court overtime, 9-1-1 dispatch, and construction details.
Rather than the Council, the governmental body which currently has the power to actualize police budget reform is the Mayor. Specifically, the current budget can be changed based on (1) the Mayor’s priorities while renegotiating police association contracts, and (2) their interpretation of exceptions for police spending written into the City Charter.
We expect that many of the City’s largest police fraternities are now in the process of renegotiating their collective bargaining agreements after their expiration on June 30, 2020, including the Boston Police Patrolmen Association and the Boston Police Detectives Benevolent Society. (There is no way to know the status of new contracts because police association negotiations are not open to the public.) As demonstrated by their statements and actions, police fraternities are neither aligned with the broader labor movement nor are they concerned with public safety; their overreaching power must be reined in.
As such, Boston’s mayor must negotiate contracts that establish reasonable salaries and free up more aspects of policing policy to be under City, not police fraternity, control. Even better, the mayor should lift the veil of secrecy around such an important process: soliciting input from community leaders and advocates when determining priorities and lines in the sand for fraternity contracts, and clearly communicating those priorities to the public. Only then might the City Council pass progressive policing policies that have a shot at actually affecting change.
Additionally, there is reason to believe that of what constitutes an “extreme emergency” as stated in the City Charter might go far to re-establish accountability structures when the police, say, go seven figures over their allocated budget. The police will likely claim that everything they do qualifies as an “emergency,” but the City doesn’t have to agree. Modern policing in Boston includes much more than 9-1-1 dispatch and urgent responses to local events; overtime policing is not emergency response.
Excessive police spending in Boston is a budgetary octopus: there are many different arms thrashing about that contribute to the problem. Between disproportionate payroll increases resulting from extremely powerful police fraternities (i.e. arbitration awards), overly generous court appearance policies that pay police for time they don’t work, monopolization of private construction details, potential misuse of sick leave policies, and costly vacation buyback programs that boost pensions, it can be hard to know where to start.
When it comes to police overtime, the past year has been a long lesson in the danger of symbolic “changes” that ultimately leave the status quo untouched. Yet local advocacy groups like Muslim Justice League and Families for Justice as Healing have not quieted their calls to redistribute police funding back into communities. Their continuing pressure for more transparency has helped to illuminate the path forward.
We know what the next steps are: Acting Mayor Kim Janey, and every mayoral administration to come, must take a strong stance against egregious police spending: refusing to agree to exploitative police union contracts and putting a foot down over “emergency” budget excesses.
Data sources:
- Data on BPD OT usage presented at March 12 Boston City Council hearing
- Documents reporting Boston FY19 departmental OT budgets (listed in FY20 documents) and OT expenditures (listed in FY21 documents)
- Adopted Boston FY21 budget
This report and analysis was authored by Lauren Chambers (ACLUM) with the guidance of Kade Crockford and Rahsaan Hall (ACLUM) . The analysis also benefitted from crucial feedback and input from members of the Muslim Justice League and the Building Up People Not Prisons Coalition.
How to Programmatically Create Dozens of Wordpress Pages to Catalogue Thousands of Documents
This technical blog is cross-posted on Medium.
So you use your Wordpress site to publicly share documents with the world. Maybe they’re photographs in your portfolio, records of minutes from your recurring meetings, homework assignments and materials for your students … or maybe they’re responsive documents from 400 public records requests. You use your site to present these documents in some sort of helpful structure.
And maybe you’ve just acquired, say, 1,400 new documents detailing the use of facial recognition across Massachusetts government agencies, which will require dozens of new structured pages with hundreds of repeated elements to properly display. Manually making all of these new pages with all of these new documents would take approximately infinity hours, and would be absolutely soul-sucking along the way.
But good news: if you’ve got some coding skills, it’s possible to programmatically create all your pages with some setup, some Python, minimal PHP, and the click of a button.
Things you’ll need:
- Wordpress site
- SSH or FTP access to the server hosting your Wordpress site
- Intermediate comfort with Python
- Openness to using basic PHP
- A deep-seated resentment for repetitive tasks
Here’s the process:
- Get your documents in order
- Generate content for (many) Wordpress pages
- Write PHP commands to create (many) Wordpress pages
- Run PHP snippet and publish - once!
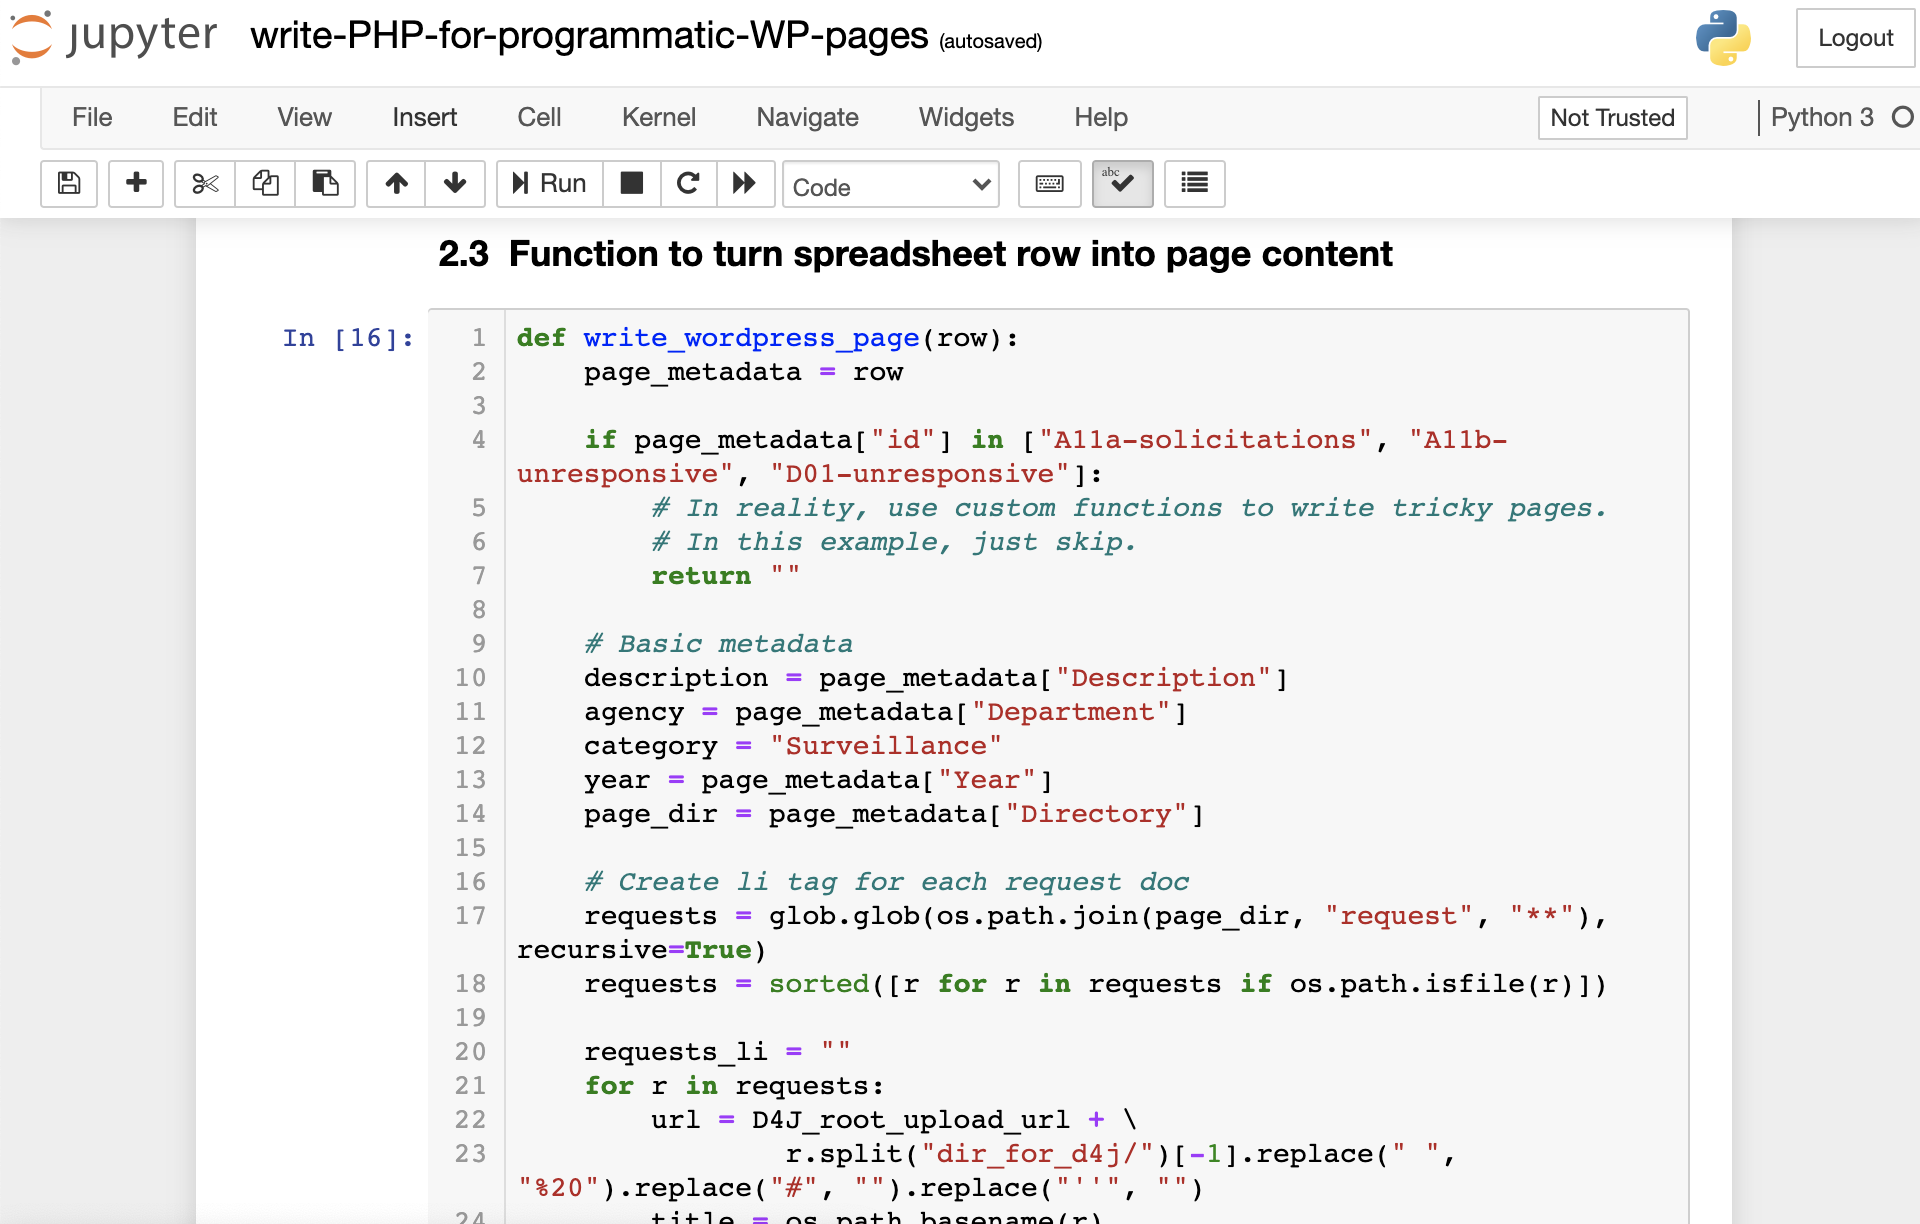
The code from steps 2 and 3 is also available in this Jupyter notebook on GitHub.
A quick note before we start: our particular Wordpress setup includes hosting with DigitalOcean, Wordpress editing with Visual Composer, and formatting via the Uncode theme. Some of the code and methods outlined here are particular to these specs.
1. Get your documents in order
First things first, you’ll need to (re)organize your documents before putting them onto the server, so that all of the documents for a single page are siloed in their own directory. This will make it possible to auto-populate the documents and any metadata in each host page later. Depending on how many documents you have and how well organized they are, this step could take a bit.
In our case, we organized the public records requests into different categories, put the documents into different folders for each public records request, and finally split up different documents based on whether they were ACLU messages, government responses, or responsive documents. We used an alphanumeric naming scheme to preserve our intended order, like so:
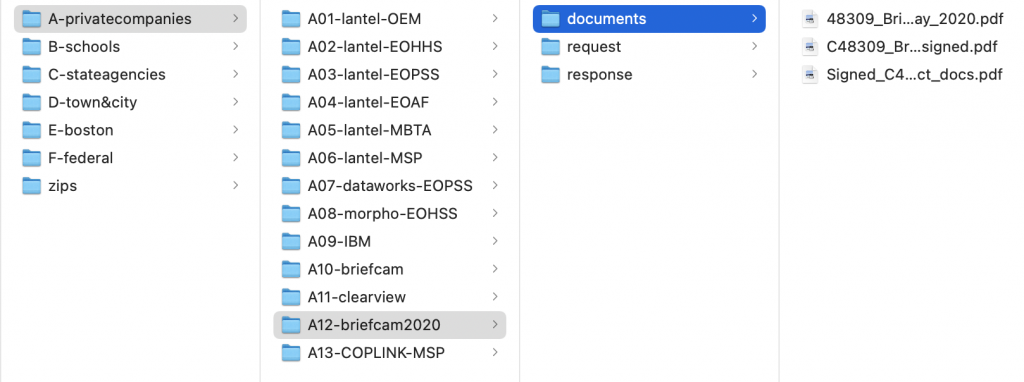
Once you’re done building up your directory structure, you’ll upload these document directories so they can be accessed from your site. Unfortunately, to preserve the structure you’ve just built, you cannot simply add your documents to the media gallery through the normal Wordpress admin interface. Instead, you’ll need to SSH into your server and upload your documents directly using rsync or an application like Filezilla.
(Warning: it took me several hours to upload 3 GB of files to the server with Filezilla!)
You’ll put all of the documents in the appropriate wp-content/uploads folder. For us, that looked something like this (we'll represent placeholders in purple):
- /server/path/to/wordpress/site/public_html/wp-content/uploads/2021/03/A-privatecompanies/A12briefcam2020/…
- /server/path/to/wordpress/site/public_html/wp-content/uploads/2021/03/C-stateagencies/C11-dot-frt/...
and so on.
Once your documents are uploaded, they should already be accessible from your site. Verify this by visiting the URL corresponding to a test file, which should be something like this:
https://homeurl.org/wp-content/uploads/year/month/custom/directories/to/filename.ext
Be sure to encode any parts of this URL that include unsafe URL characters like spaces, hashtags, percent signs, apostrophes, or commas.
With encoding, the document that lives on the server at:
will be available at this URL:
Next, the fun part: programmatically writing your pages.
2. Generate content for (many) Wordpress pages
This step requires creating two components: a spreadsheet which collects certain information for each page you’re publishing, and a Python script which turns that spreadsheet into page content.
For each page, the spreadsheet must include at the very least:
- The path to that page’s document directory (that we just created in step 1) on your local computer
- Any details you’d want to include on the page (e.g., title, date, descriptive text)
Here’s an example of how it might be structured:
| id | Title | Year | Description | Directory Path |
| A12-briefcam2020 | Briefcam at the City of Boston | 2020 | This FOIA request sees no evil | /local/path/to/A-privatecompanies/A12-briefcam2020/ |
| B01-EOPSS | EOPSS Grants for Surveillance Tech in MA Schools | 2019 | This FOIA request hears no evil | /local/path/to/B-schools/B01-EOPSS/ |
| C11-dot-frt | Face Recognition at the Department of Transportation | 2019 | This FOIA request speaks no evil | /local/path/to/C-stateagencies/C11-dot-frt/ |
And now, Python! The basic idea here is to create templates for the parts of your pages that will be the same, and manipulate the information in the spreadsheet to fill in the parts that are unique.
First, you’ll need to create a template for how you’d like your page to be structured: rows and columns, headings, etc. It might include both Wordpress syntax (I use Visual Composer) and raw HTML. Here’s a simple example, a Python string with replacement fields shown in red.
page_template = '''
[vc_row]
    [vc_column][vc_column_text]
        <h2><span style="color: #000000;">Background</span></h2>
        <span style="color: #777777;">
            {description}
        </span>
        <h4>Year:</h4>
        <span>{year}</span>
        <h4>Documents Returned:</h4>
        <span>{n_docs}</span>
    [/vc_column_text][/vc_column]
[/vc_row]

[vc_row][vc_column][vc_column_text]
    <h2>Responsive Documents</h2>
    {docs_table}
[/vc_column_text][/vc_column][/vc_row]
'''
Some of these placeholders - like the description and the year - can be filled in directly from the spreadsheet columns. Others - like the number of documents and the document table - require some further steps.
We can determine the number of documents that will be listed on one page by counting the number of documents within a page’s directory:
import glob
import os
import pandas as pd

# Load spreadsheet with pandas and pull out one row (one page)
all_pages_df = pd.read_excel("db_face_rec_pages.xlsx")
page_metadata = all_pages_df[0]

# Pull out page information from the spreadsheet
description = page_metadata["Description"]
agency = page_metadata["Department"]
category = "Surveillance"
year = page_metadata["Year"]
page_dir = page_metadata["Directory"]

# Count total number of documents
docs = glob.glob(os.path.join(page_dir, "documents", "**"), recursive=True)
n_docs = len([d for d in docs if os.path.isfile(d)])
Writing the raw HTML for the table that will list all documents is a bit more complex. Here, our table will have four columns: a count of files, the file name, type, and size. We iterate through all of the documents inside our page’s directory to fill out docs_table.
import urllib

D4J_root_upload_url = "https://data.aclum.org/wp-content/uploads/2021/02/"

# Create table row (tr) for each document
docs_table = '''
<table><tbody>
    <tr>
        <td>#</td>
        <td>File Name</td>
        <td>File Type</td>
        <td>File Size</td>
    </tr>
'''

doc_filepaths = [d for d in docs if os.path.isfile(d)]
for i, d in enumerate(doc_filepaths):

    # Alternate row color
    row_color = " background-color: #f2f2f2;" if i%2 == 1 else ""

    # Determine the Wordpress URL for each document and encode it
    url = D4J_root_upload_url + d.split("dir_for_d4j/")[-1]
    url = urllib.parse.quote_plus(url) # encode

    # Parse the name and extension from the filename
    filename = os.path.basename(d)
    title = os.path.splitext(filename)[0]
    extension = os.path.splitext(filename)[1].upper()[1:]

    # Determine what the file size is (and format in KB/MB/GB)
    size_bytes = os.path.getsize(d)
    if size_bytes < 1e6:
        size = "{:.1f} KB".format(size_bytes / 1e3)
    elif size_bytes < 1e9:
        size = "{:.1f} MB".format(size_bytes / 1e6)
    elif size_bytes >= 1e9:
        size = "{:.1f} GB".format(size_bytes / 1e9)

    docs_table += '''
    <tr style="{row_color}">
        <td>{i_doc}</td>
        <td>
            <a style="color: #006cff;" href="{url}">{title}</a>
        </td>
        <td>{extension}</td>
        <td>{size}</td>
    </tr>
    '''.format(row_color=row_color, i_doc=i+1, url=url, title=title,
              extension=extension, size=size)

docs_table += "</tbody></table>"
With n_docs and docs_table created, we can fill in the main page template:
page_content = page_content_template.format(
        description=description, year=year,
        n_docs=n_docs,docs_table=docs_table)
Finally, we’ll put all of this into a function, and use pandas’ apply()method to repeat it for every row in the dataframe.
def write_wordpress_page(row):
    page_metadata = row
    # Pull out metadata and calculate n_docs
    ....
    # Create HTML docs_table for each doc
    ....
    # Combine templates to produce page_content for this page
    ....
    return page_content

all_page_content = all_pages_df.apply(lambda row: write_wordpress_page(row), axis=1)

# Add this page content strings as a column to the original dataframe
all_pages_df["page_content"] = all_page_content
Now we’ve got the page content for all of the pages we want to make. Our next step is to craft the PHP commands that will publish these pages on our Wordpress site.
(For anyone who’s nervous about PHP, worry not: the command we need to do this is extremely simple!)
3. Write PHP commands to create (many) Wordpress pages
To get our page content onto the site, we’re going to use a simple PHP function: wp_insert_post(). This function lets you add a new post or page to your site, and lets you specify not only the content of the post but also the title, publishing mode (public, private, password-protected), parent page, author, and more.
We’re going to use a bit more Python to generate these PHP commands - one for each page we want to use. Again, we’re going to start with a template that we’ll customize:
php_snippet_template = '''
// Add page after wp_loaded
add_action( 'wp_loaded', function () {{

    $post_content = "{content}";
    $title = "{title}";
    $new_page = array(
            'post_title'     => $title,
            'post_name'      => strtolower(str_replace(' ', '-', trim( $title ))),
            'post_status'    => 'publish',
            'post_content'   => $post_content,
            'post_type'      => 'page', // Rather than a post
            );

    // Check to make sure the page doesn’t already exist
    $check_page_exist = get_page_by_title( $title, 'OBJECT', 'page');
    if(empty($check_page_exist)) {{
        $page_id = wp_insert_post( $new_page );
    }} else {{
        error_log($title . " page already exists; not inserting new post");
    }}
}});
'''
We just need to fill in the content and title for each page (again using the handy apply() method from pandas), and then write all of the page-creating commands into one long file (I’m calling it insert_all_pages_php_snippet.txt):
def create_php_snippet(row):
    php_snippet = php_snippet_template.format(
        content=row["page_content"],
        title=row["Title"]
    )

    return php_snippet

# Generate a snippet for each row (i.e. for each page)
all_snippets = all_pages_df.apply(lambda row: create_php_snippet(row), axis=1)

# Write the snippets to a file
with open("insert_all_pages_php_snippet.txt", "w+") as fo:
    for s in all_snippets:
        fo.write(s)
Finally, we’re ready to run the PHP on our site and go live with our new pages!
4. Run PHP snippet and publish - once!
I’ve found that the easiest way to run one-time PHP commands on our Wordpress site is with the Code Snippets plugin. This plugin allows you to write, save, and run small chunks of PHP code on your site.
Using Code Snippets, publishing all of the pages is as easy as 1, 2, 3:
- Create a new snippet and select the “Only run once” radio button at the bottom of the code box
- Paste the entire contents of insert_all_pages_php_snippet.txt into the snippet
- Press “Execute Once”
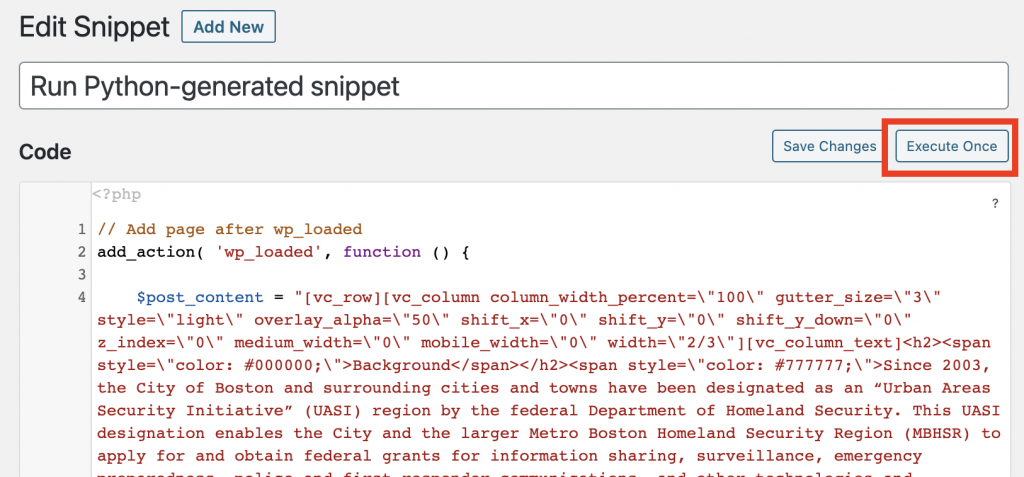
Provided you don’t have any errors in your PHP, that’s that! Ta-da and hallelujah. Let out a deep breath, put on your comfy pants, and grab yourself a beer, because you’re done.
For programmers who want to see how this method was implemented in situ to generate 64 pages housing 1,403 documents on the ACLU of Massachusetts’ facial recognition document repository, checkout our Jupyter notebook on GitHub.
Our notebook also includes examples for how to make more complex pages than detailed here, including:
- Creating pages as children of different parent pages
- Adding buttons on certain pages that link to external sites
- Using HTML to specify custom fonts, colors, and font sizes
- Creating password-protected pages
- Adding custom categories to your generated pages so they’re easier to find
To learn more about the ACLU of Massachusetts’ technical work, explore more around this Data for Justice site: https://data.aclum.org
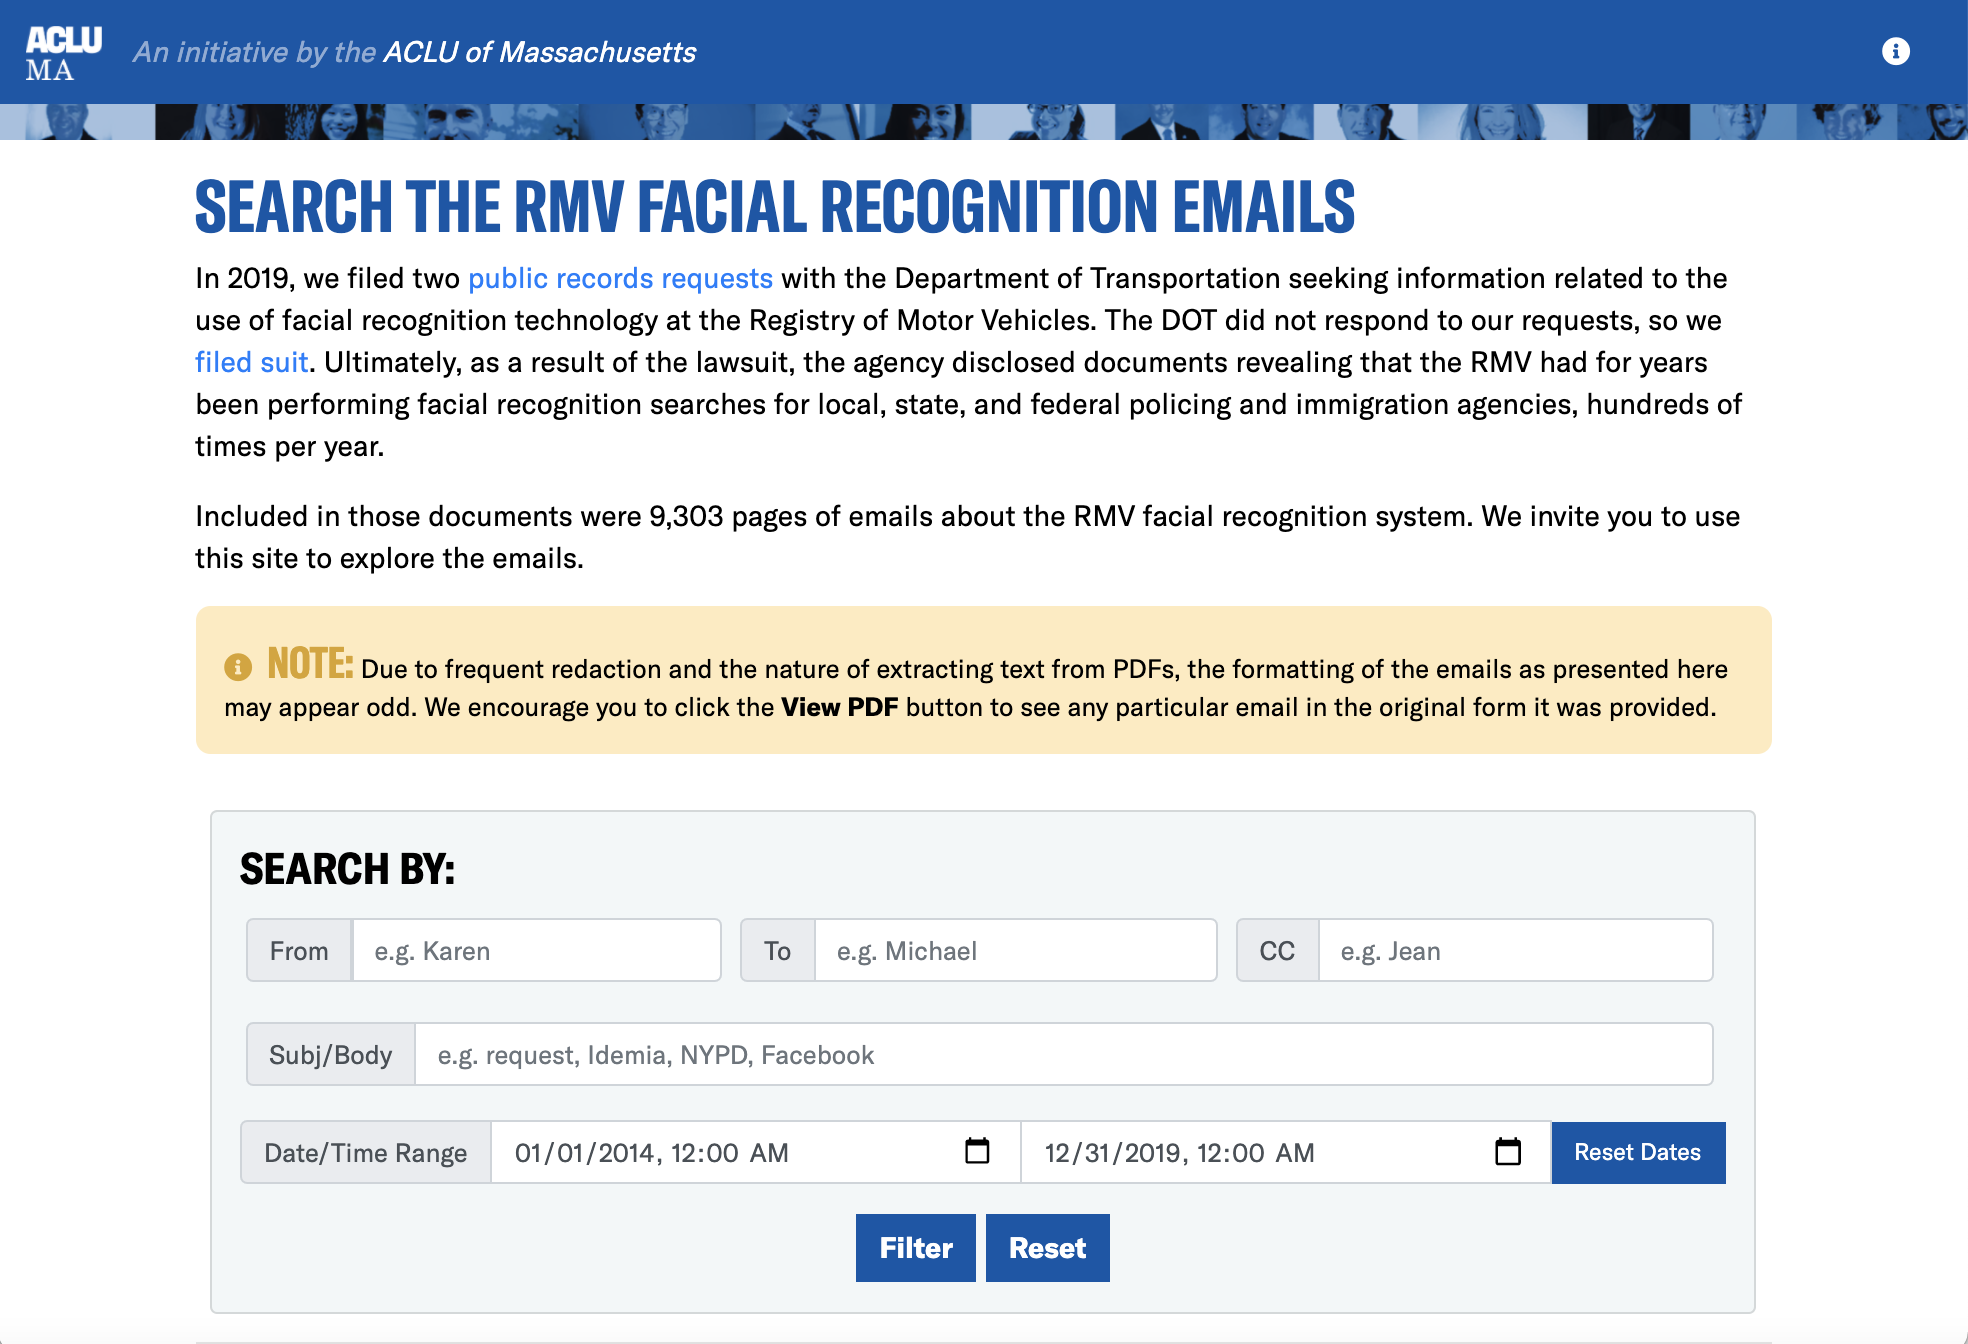
Clearview, Cameras, and Karen: Newly Released Documents Expose Facial Recognition Technologies Used Across Massachusetts
Today, the ACLU of Massachusetts published a repository of over 1,400 documents which paint a picture of how government agencies across Massachusetts have been using facial recognition technology in recent years. The repository catalogs the breadth of contexts in which the Massachusetts government has flirted with facial recognition, a dystopian technology that is dangerously inaccurate when used on faces with darker skin, feminine features, younger features, or older features.
These documents are the result of over 400 individual public records requests filed predominantly between 2018 and 2020. They chronicle facial recognition surveillance technologies being marketed to and used in state agencies, municipal police departments and schools, and they include hundreds of solicitations from tech companies aggressively marketing their products to a wide range of government agencies.
Explore the Facial Recognition Document RepositoryHere we present highlights from this document repository, namely:
- The widespread and unregulated use of facial recognition scans run by the Massachusetts Registry of Motor Vehicles, on behalf of law enforcement agencies across the country
- An aggressive and, in some cases, successful law enforcement marketing campaign by dystopian surveillance startup Clearview AI
- Multiple instances of smaller companies partnering with government agencies to deploy dangerous surveillance technologies without public knowledge
Great Power Without Responsibility: Facial Recognition at the RMV
The largest and most comprehensive state or local government facial recognition program in Massachusetts is managed by the Registry of Motor Vehicles (RMV). This system was put in place in 2006 with the original goal of investigating fraud in the licensing process. Almost immediately after obtaining its facial recognition system fifteen years ago, the RMV told policing entities throughout the state that they could send photos of unknown persons to be searched against its statewide license and identification photo database.
Documents obtained by the ACLU of Massachusetts through a public records lawsuit show that the RMV ran hundreds of scans for police each year, and not just for Massachusetts entities. ICE, the DEA, the Department of Homeland Security, and NYPD all requested scans between 2016 and 2018.
The records show the RMV performed these searches absent any state law or regulations to govern their use, and without any judicial oversight or internal mechanisms to prevent abuse. In order to request a scan, law enforcement and immigration authorities simply sent emails claiming to be from law enforcement, with no verification required. Searches were recorded in written logs only, apparently in red colored pencil, and with spurious reporting standards: over 70 scans were run in 2016 and 2017 on behalf of an employee listed simply as “Karen.” Multiple emails describe scans that were run using photos taken from personal Facebook profiles. According to the records, the RMV did not decline a single search request from any law enforcement official during the time period covered by the records request.
During that period, the RMV facial recognition system was used by a wide range of parties. In Massachusetts, while the Boston and Cambridge Police Departments each submitted dozens of requests, over 30 other departments submitted one or more.
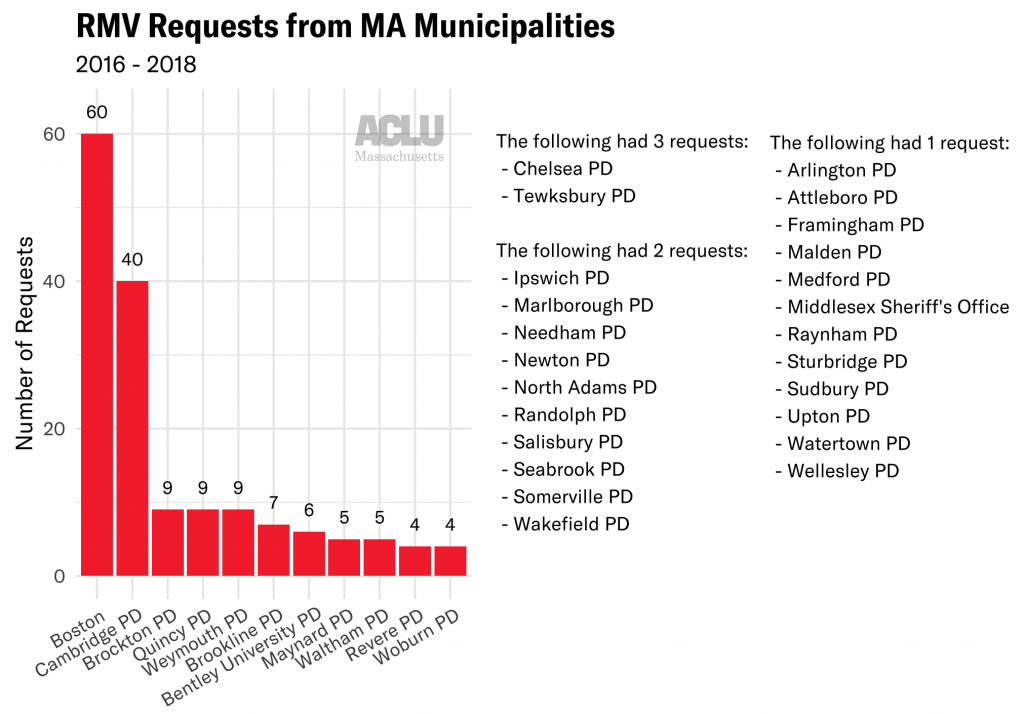
Many officers from out-of-state successfully requested searches, including the South Carolina DMV, the New Hampshire State Police, Rhode Island Police, and the NYPD. Federal agencies took advantage, too: requests appear in the logs from Customs and Border Patrol, the Department of Homeland Security, ICE, the Secret Service, and the IRS.
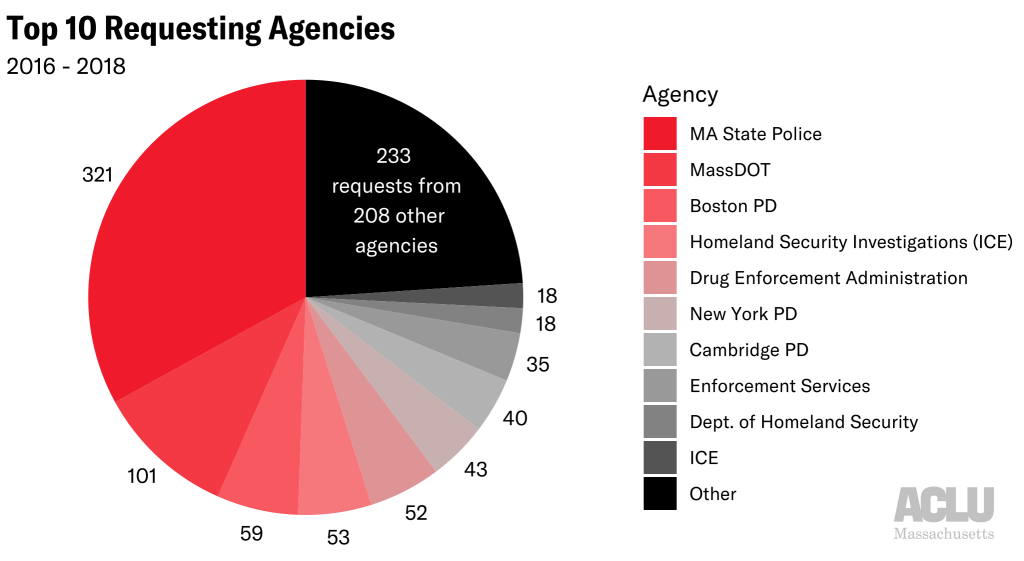
What was the reasoning behind these scans; were they tied to violent crime investigations, petty theft, immigration, or just an officer curious to dig up dirt on an ex? Did the RMV take steps to mitigate the known racial bias of the software? The RMV’s handwritten logs provide no context. Given that the RMV facial recognition system contains a photo of every individual with a Massachusetts driver’s license or state identification card, these regulatory failures are particularly irresponsible and dangerous.
Dystopia, Get Your Dystopia Here: Clearview’s Marketing Tactics
In 2019, national news stories broke about a terrifying new technology company that links facial recognition results to other content on the internet. With a single facial image, Clearview AI claims it can identify an individual’s photos that are linked to Facebook, Twitter, Flickr, YouTube, and more. Clearview pulls off this freaky feat by scraping billions of images from social media sites— despite being told to cease and desist by multiple companies.
A leak of Clearview’s data in early 2020 revealed widespread use of Clearview by over 2,000 police departments nationally, as well as numerous foreign governments and private companies. Concerned about its adoption in Massachusetts, the ACLU of Massachusetts filed public records requests with every police department in the Commonwealth - 346 in total - to obtain emails mentioning Clearview.
These emails show the company successfully gaining a foothold among Massachusetts law enforcement. At least eight law enforcement agencies statewide accepted Clearview’s invitation to start a free trial of their software: Agawam PD, Marlborough PD, Somerset PD, Wellesley PD, Yarmouth PD, Falmouth PD, Norfolk County Sheriff’s Office, and Oxford PD. In Somerset, the police department originally denied in writing using Clearview until data was leaked revealing one detective had indeed been using a free trial, possibly without the knowledge of department superiors—let alone residents or local elected officials. The detective even used Clearview to run a scan on behalf of an NYPD officer. Such stories demonstrate that in the absence of community control of police surveillance, police and private companies often work together in the shadows to dangerously expand police surveillance tactics.
Records also show an aggressive marketing scheme towards PDs that ultimately didn’t bite: at least 36 Massachusetts police departments received solicitations from Clearview - and probably many more, given that not all record requests were answered. These solicitations were sometimes sent directly from Clearview, but more frequently were sent by publications such as American Police Beat Magazine, Officer.com, or Police Magazine– an indicator of the chilling extent to which facial recognition is marketed to the police. Clearview’s own marketing encourages its users to “take a selfie” or run a search on a celebrity’s photo - behavior that would most likely be barred if the use of the technology were subjected to any sensible rules, regulations, or laws.
Here, There, Everywhere: Facial Recognition Throughout Government
Unfortunately, Clearview and the RMV are just the tip of the iceberg when it comes to government use of facial recognition in Massachusetts. From records requests filed with government offices in over 40 Massachusetts cities and towns, multiple cases arose of small companies peddling dangerous technologies for government use.
In the Town of Plymouth, for example, emails from 2018 reveal extensive communication between the chief of police and Jacob Sniff, the young founder of a billionaire-backed facial recognition startup called Suspect Technologies. At one point during discussion about the Plymouth PD adopting his software, Sniff admits that his product might work just “30% of the time” on poorer-quality images such as those taken from surveillance camera footage. Showing a baffling degree of hubris, Sniff also asks the police department to help him get access to the RMV database - a government system containing personally identifiable information for over 5 million Massachusetts residents. After the ACLU disclosed these emails to the press, the Plymouth Police Department said it would not contract with the company. But these emails show how profit-hungry companies are quietly pressuring even small police departments to buy into unreliable dystopian technologies, and that absent strong law to protect people’s rights and the public interest, police are all too often eager to sign up.
In Revere, we learned that the public school system uses a visitor management software called LobbyGuard that claims to “screen and track everyone who enters your schools.” Though the school district asserts that LobbyGuard does not use facial recognition, the use of such a technology raises concerning questions about privacy and surveillance in school settings, the transfer of sensitive data to little-known corporations, and the role of private companies in expanding government surveillance.
And in the City of Boston, a looming software update from a video analytics company called Briefcam threatened to supercharge all of the region’s networked surveillance cameras with face surveillance software with just the click of a button. Documents from 2019 show that the City upgraded their Briefcam video analytics software to version 4.3. Just a year earlier, Briefcam had launched a new facial recognition feature – in version 5.3. All the City had to do was install a single software update, and the faces of hundreds of thousands of Boston residents and visitors would have begun to be systematically cataloged. Thankfully, a facial recognition ban backed by the ACLU, the Student Immigrant Movement, and many other organizations unanimously passed by the Boston City Council in June makes any such software update illegal in the City of Boston.
What’s perhaps most frightening about these documents is the pattern they suggest: it’s clear that this predatory and biased technology has found fertile ground to take root among Massachusetts government agencies. At least ten municipal police departments have embraced facial recognition technologies provided by unregulated third-party private vendors. And if officers aren’t wary of starting a free trial with Clearview, and police chiefs feel comfortable negotiating contracts with fledgling companies like Suspect Technologies, where would they draw the line?
Without law preventing it, more software trials will be started, more contracts will be signed, and more Massachusetts residents will be endangered. We don’t have to speculate – multiple cases of Black men being wrongfully arrested on the basis of faulty facial recognition scans warn of how this story might end.
These documents further underscore the importance of a newly proposed bill that would impose strict limitations on the use of face surveillance by Massachusetts government agencies. While the state police reform bill that was passed in December 2020 includes some regulations on police use of facial recognition, the newly proposed bill goes much further, prohibiting the vast majority of government agencies from obtaining or possessing the technology and thus protecting Massachusetts residents from aggressive marketing campaigns waged by companies like Clearview and Suspect Technologies. The bill would also enforce a higher standard on police use of facial recognition, requiring a warrant, limiting the technology’s use to serious investigations, establishing key due process protections, and establishing a supervised, centralized process for all facial recognition searches.
![]()
We must enact strong and unambiguous law to govern facial recognition technology - because as these documents show, we cannot trust law enforcement and private companies to regulate themselves.
If you’re interested to learn more about how facial recognition might affect your community, we invite you to visit the Press Pause on Face Surveillance homepage, and explore the document repository on the ACLU of Massachusetts’ Data for Justice Site:
Explore the Facial Recognition Document Repository