Data Show COVID-19 Out of Control Across Massachusetts Prisons and Jails
Four county facilities with over 80 confirmed COVID-19 cases. Multiple county jails conducting fewer than 100 COVID tests over nine months. A 10 percent increase in individuals jailed before trial across the state.
Yesterday, together with the Committee for Public Counsel Services (CPCS) and the Massachusetts Association of Criminal Defense Lawyers (MACDL), the ACLU of Massachusetts filed an amended petition in their existing case with the Supreme Judicial Court seeking relief for individuals incarcerated in county facilities who are currently threatened by the spread of COVID-19 across the state.
Almost nine months have passed since ACLUM first filed this lawsuit in late March, asking the Court to recognize the elevated risk that the pandemic posed to individuals incarcerated in both county and state facilities and to decrease the population of carceral facilities across the state. The Court’s ruling recognized the necessity of decreasing the incarcerated population, and ordered jails and prisons throughout the state to regularly report their population, releases, COVID-19 tests and results.
While yesterday’s filing focuses solely on county facilities, the data reported by both county and state facilities since April raise significant concerns regarding COVID-19 in carceral settings throughout the state.
An interactive dashboard created and maintained by the ACLU of Massachusetts presents weekly data reported by 19 facilities run by 13 county sheriffs (jails and houses of correction or HOCs) and daily data from 16 state Department of Correction (DOC) prisons – 35 facilities in sum. Analysis from the first week of reporting in April already demonstrated an inadequate COVID response in prisons and jails that, unfortunately, has continued for the better part of a year. Indeed, in recent weeks, advocates, attorneys, and worried family members have witnessed frighteningly low test rates, followed by outbreaks in over a dozen facilities – and now, deaths. Here we present four takeaways from recent trends.
1. A battle against multiple simultaneous outbreaks
Since outbreaks of COVID-19 began increasing in Massachusetts in September, 27 prisons and jails statewide have seen more than 5 prisoners or staff infected with COVID-19. Seven facilities have seen more than 100 positive tests, and four facilities saw more than 100 simultaneous cases in a single outbreak.
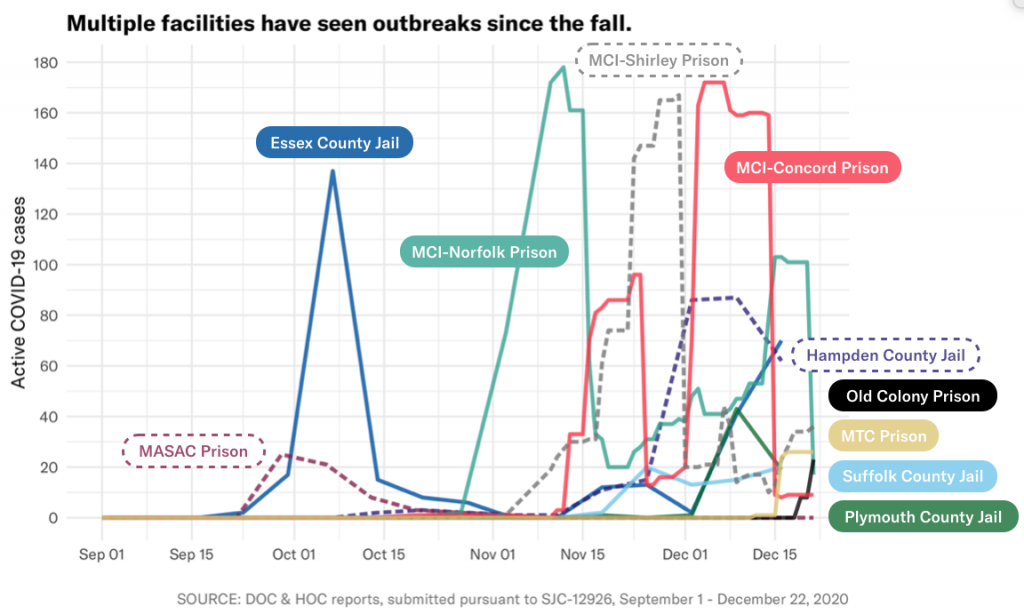
In some state prisons, vast swaths of the facility’s prisoner population were (or are) infected at the peak of the outbreak, including: 33 percent of MCI-Concord (1 in 3) on December 7, 15 percent of MCI-Shirley on November 30, and 14 percent of MCI-Norfolk (1 in 6) on November 12.
| Facility Name | Positive tests (staff & prisoners), cumulative since Sept. 1 | Maximum active prisoner cases at peak of outbreak | Maximum active staff cases at peak of outbreak† |
| Barnstable County Correctional Facility | 10 | 0 | 9* |
| Bristol County Jail and House of Correction | 25 | 5 | 13* |
| Essex Middleton House of Correction | 257 | 137* | Not reported |
| Hampden County Correctional Center | 233 | 87 | 30* |
| Middlesex Jail & House of Correction | 46 | 9 | 26* |
| Plymouth County Correctional Facility | 123 | 43 | 35 |
| Suffolk South Bay House of Correction | 84 | 19 | 11 |
| Suffolk Nashua Street Jail | 41 | 17* | 8* |
| [DOC] Massachusetts Alcohol and Substance Abuse Center | 65 | 25 | Not reported |
| [DOC] MCI-Concord | 356 | 172 | Not reported |
| [DOC] MCI-Norfolk | 498 | 178 | Not reported |
| [DOC] MCI-Shirley | 337 | 167* | Not reported |
| [DOC] Massachusetts Treatment Center | 49 | 26* | Not reported |
| [DOC] North Central Correctional Institution | 228 | 83* | Not reported |
* - active positive cases stagnant or increasing as of December 22
† - no DOC facilities report active staff cases
The bottom line is that COVID-19 is raging across our jails and prisons, and the existing response is clearly proving inadequate.
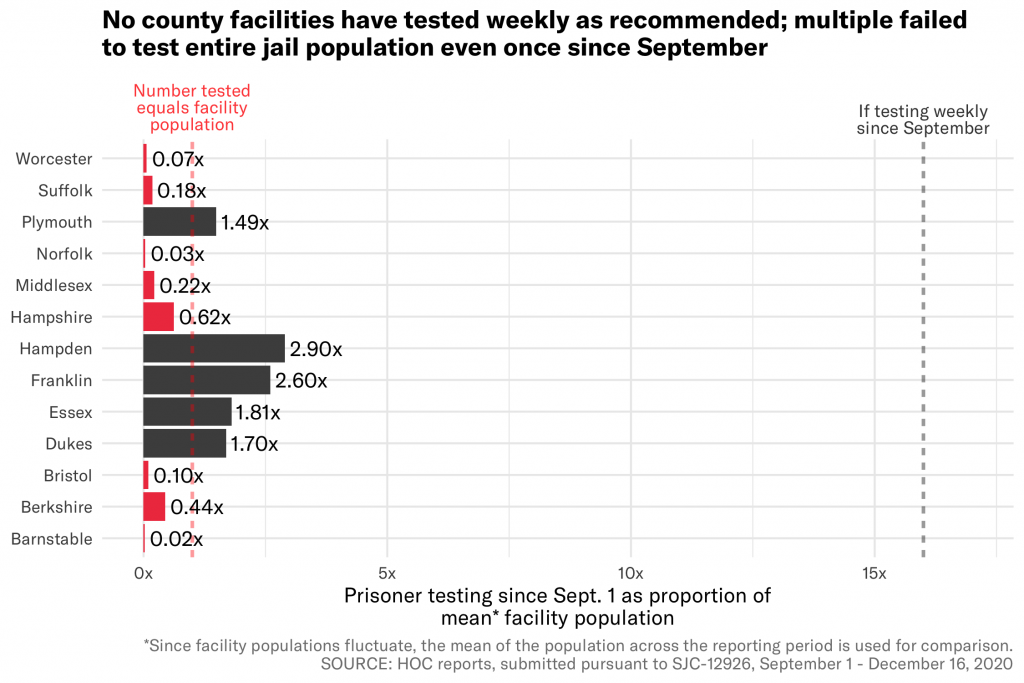
2. Testing has been consistently abysmal
There is a major and concerning caveat to available data on outbreaks: the numbers described above are just those COVID-19 cases that were confirmed via testing. Many prisons and jails are still not testing at a sufficient rate to detect and contain cases, and so there is reason to believe even the extreme outbreaks we’ve seen are underestimates.
Indeed, eight counties have not even conducted enough testing to account for their entire population once since outbreaks began accelerating in September. The most egregious examples include Barnstable County, which has conducted just 4 COVID tests since September while their prisoner population never dipped below 170and Worcester County, which has conducted just 39 COVID tests since September while their prisoner population never dipped below 566.
For comparison, Tufts University – which has a similar student population to the statewide prisoner population – has conducted almost as many tests in the previous 7 days (13,104) as all 13 county facilities have in the past nine months (13,562). And since August, Tufts has conducted more than 7 times as many tests (256,156) as all Massachusetts prisons and jails have since April (35,157).
And it’s not just private universities that are blowing jails out of the water; a state policy defined in June requires all staff at long-term care facilities to be tested weekly. The most recent state report showed that 407 of the 427 long-term care facilities in the state (95 percent) are currently compliant with this policy, as of the week of December 3-10.
The abysmal level of testing in jails is simply unacceptable, and they leave government officials effectively clueless as to whether new outbreaks are taking root across their facilities.
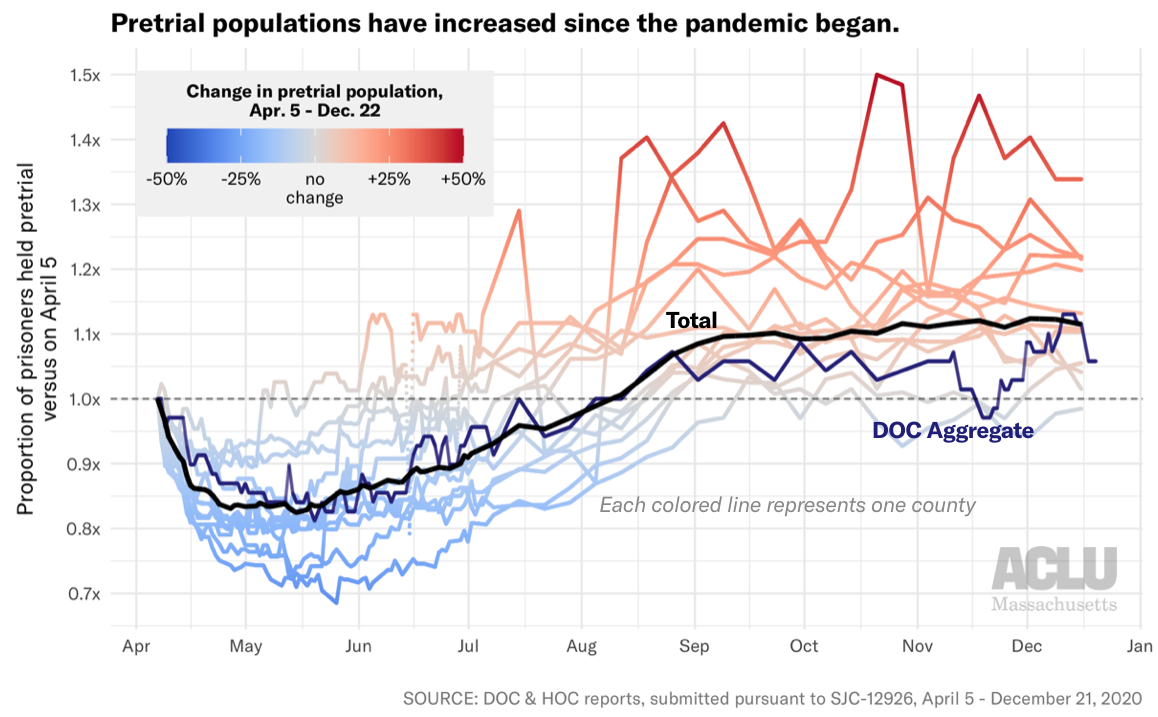
3. Rising prisoner populations increase danger
Yet testing is not the only preventative measure that prisons and jails have at their disposal, nor is it the only response that they are failing to properly implement.
One of the most effective measures to curb the spread of COVID is to reduce the population of incarcerated people – fewer people in cramped quarters reduces spread and saves lives. But concerningly, recent data show that many facilities are actually increasing their populations now, after a drop in the spring. And the population of those being held pretrial – people who have not been sentenced with a crime but are currently incarcerated – is actually higher today than it was at the start of reporting in April. Over 400 more people are currently incarcerated pretrial than nine months ago: 4,355 on December 16 compared to 3,928 on April 5.
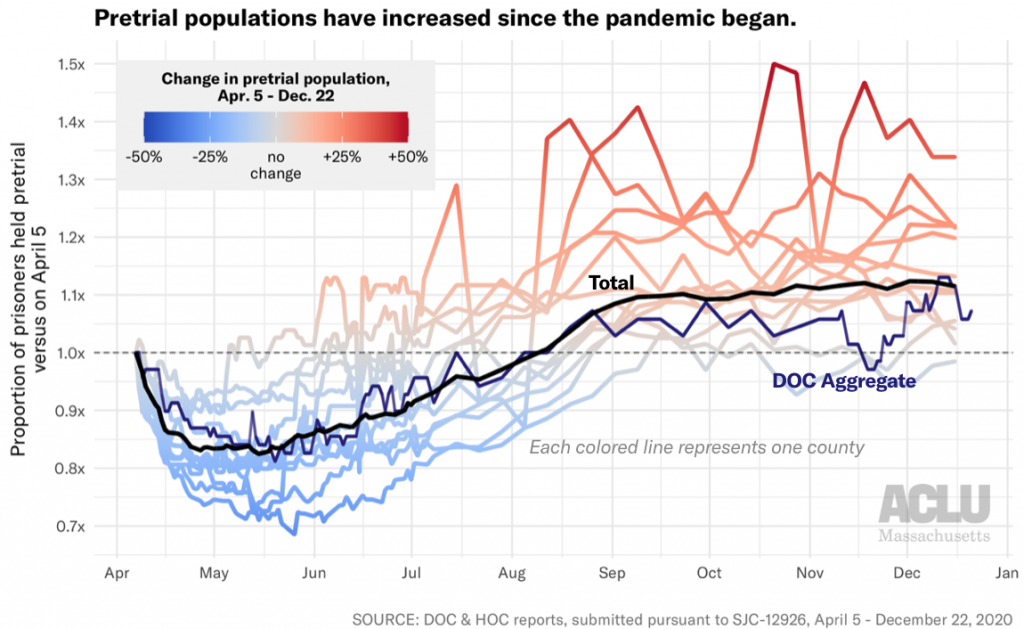
Franklin County saw the largest proportional increase with a 34 percent jump in pretrial prisoners since April – from 62 to 83. In larger facilities, the raw difference is even more stark: Hampden County has 106 more prisoners held pretrial today than in April (+22 percent), Bristol County has 86 more (+20 percent), Essex County has 84 more (+13 percent) and Suffolk County has 75 more (+11 percent). And across all DOC facilities, we also see a 7 percent increase in pretrial prisoners, from 69 to 74.
Overall, while the statewide incarcerated population fell by over 2,000 in the first few months of the pandemic, the population has risen by 300 since the lowest point in late June. Rather than further stuffing already crowded carceral facilities, Massachusetts should instead be following in the footsteps of states like Colorado, which has reduced their jail population by 46 percent during the pandemic.
One available tool for decarceration is to release those prisoners who are statutorily eligible to home confinement. Recent analysis by CPCS estimates that approximately 427 prisoners held in county facilities as of December 11, 2020 were eligible for home confinement programs. However, three of the 13 counties do not even have a home confinement program, and those that do have such programs not used them to meaningfully reduce their populations. Indeed, as of November 5, 2020, a total of just 16 individuals were on home confinement from a county facility. Similarly, while the DOC has a home confinement program, available data show it has made no placements since at least .
Prisons and jails need to use every tool in their toolbox to protect those in their care, and decarceration is one of the most effective tools. Massachusetts must drastically step up its prisoner releases and decarceration efforts immediately.
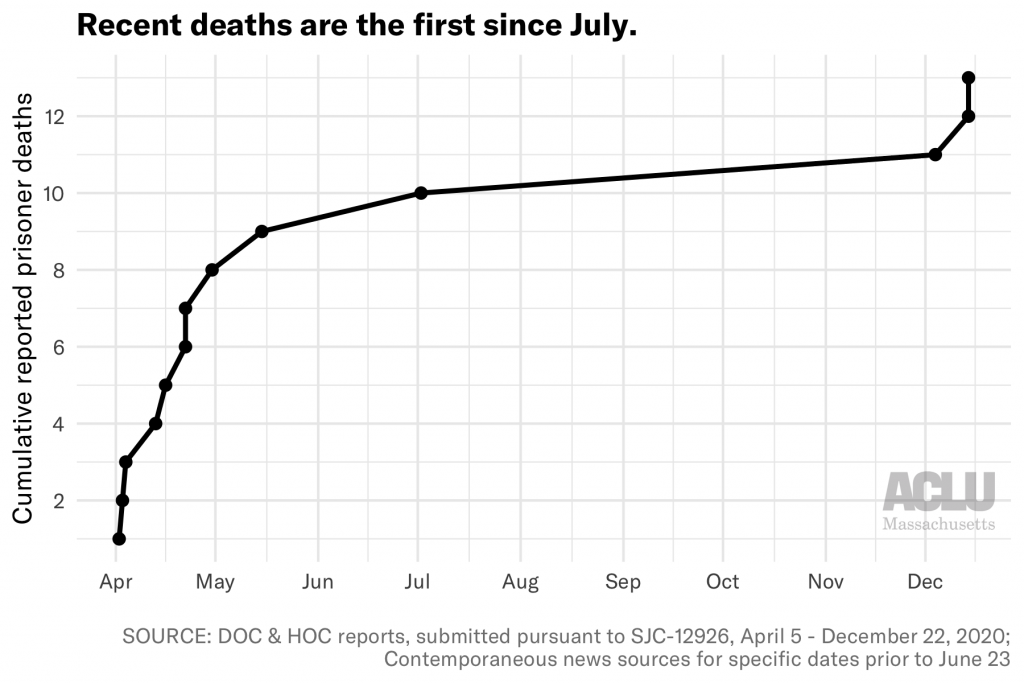
4. The consequences of inaction are fatal
Of course, these data on cases and positives represent human lives.
The DOC recently reported that a prisoner at MCI-Norfolk died from COVID-19 complications in their custody on December 4th. Two prisoner deaths were subsequently reported on December 14th, at MCI-Concord and MCI-Shirley. These reports come after the state saw no deaths for five months through the summer.
Furthermore, a shocking WBUR story in early December revealed that in at least two cases, the DOC approved medical parole for prisoners less than 24 hours before their death. Because these individuals were no longer technically in DOC custody, their deaths were not included in DOC reports to the petitioners.
One of these deaths was Milton Rice, a 76-year-old prisoner who had applied for medical parole in March, stating, "with my underlying health condition and compromised immune system issues, should I contract the COVID-19 virus it would more than likely be fatal for me." He was finally granted medical parole on November 24, two weeks after testing positive, and he died of COVID-19 pneumonia on November 25 – the day before Thanksgiving.
As counsel in the SJC case wrote on March 24th, "There are about 16,500 human beings in our prisons and jails. None of them have been sentenced to death. Yet, without aggressive and immediate intervention, COVID-19 will likely kill many of them." We have seen at least 13 deaths since then, with no appropriate response in sight.
The numbers presented here describe only the tip of an iceberg of an inadequate COVID-19 response. In a federal filing last month, Plymouth County Correctional Facility stated that asymptomatic staff at their facility were “not required to quarantine following an exposure to COVID-19.” One such staff member who returned to work tested positive less than a week later. Plymouth has since indicated that it has “resumed quarantining all close contacts and will only reduce the quarantine period in the future as required to maintain the safety and security of inmates and detainees.” Lockdowns, restrictions on visitation, and the use of solitary confinement as quarantine have been widely implemented – to the detriment of prisoners’ mental health over the past nine months. And throughout the pandemic, there have been reports from inside facilities of staff not consistently wearing masks or PPE.
Two weeks ago, Governor Baker’s office announced that Massachusetts will become one of the few states to include incarcerated individuals in Phase One of the statewide COVID vaccination plan. While this is an important and necessary measure for the future, it does not absolve the government of its responsibility to protect prisoners today; major changes are necessary to ensure that prisoners stay alive long enough to receive a vaccine. And for many, the vaccine will be too little and too late to right the wrongs affected by harmful policies over the past nine months. We know of at least 2,500 Massachusetts prisoners who have already been infected with this disease, and the consequences for their families and communities will be long-lasting.
Also two weeks ago, Governor Baker vetoed line item 8900-0001 from the proposed FY21 budget, which would create an independent ombudsman office to monitor COVID-19 in prisons:
https://twitter.com/justicehealing/status/1337499657069621250
The proposed office was a hard-fought victory by advocacy groups such as Families for Justice as Healing (FJAH), and already represented a legislative compromise. Unfortunately, this veto is just further evidence of the state’s failure to take sufficient action to protect those in their custody in the midst of this pandemic.
State and county governments in Massachusetts must take responsibility for the humanitarian crisis currently threatening – and killing – those in their care. They must drastically increase testing and both pretrial and post-conviction releases immediately, and provide more transparency on how vaccines will be distributed inside prisons and jails.
Take action:
- Use the Building Up People Not Prisons Coalition’s toolkit to contact your state legislators and urge them to override Baker’s veto of the correctional oversight office
- Use FJAH’s toolkit to contact the Department of Public Health commissioner and Department of Correction commissioner, urging them to reduce prison and jail populations and systematize COVID-19 testing
Police in Politics: Tracing Police Contributions to Boston Political Campaigns
In a prior post, the Data for Justice Project explored the huge portion of the city of Boston’s budget spent on policing. The bulk of the Boston Police Department’s budget goes towards payroll. Many Police Department employees earn enormous salaries and overtime compared to other city employees. New analysis shows that the BPD’s overstuffed budget and extraordinarily high pay are matched by large contributions to local candidates by police officers and staff and unions representing them.
It’s a cliché in politics: Follow the money. In that tradition, below we begin to explore which Boston politicians received donations from police or police-affiliated organizations, when, and for how much money.
This analysis was completed by the BU Spark! Data project in collaboration with the ACLU of Massachusetts’ Data for Justice project and Mijente.
Learn More: Visit our project site which hosts detailed visualizations of police campaign donations to Boston politicians.
About the Data
All campaign donation data presented here are publicly available in raw form at the Massachusetts Office of Campaign & Political Finance (OCPF).
In determining which political donations originated from police, our analysts included occupations within the Boston Police Department, as well as police membership organizations elsewhere in Massachusetts and around the country. Please note that occupation and employer are self-reported by the person making the contribution.
Our team analyzed contributions from the past ten years for Boston City Council members and the Mayor.
Police Contributions to Mayor Walsh
As the chief executive in a strong-mayor system, Boston Mayor Marty Walsh attracted the lion’s share of police donations in the city, totaling $456,548 in the last decade. While the donations began with Walsh’s first run for mayor in 2013, Walsh has seen consistent support every year since.
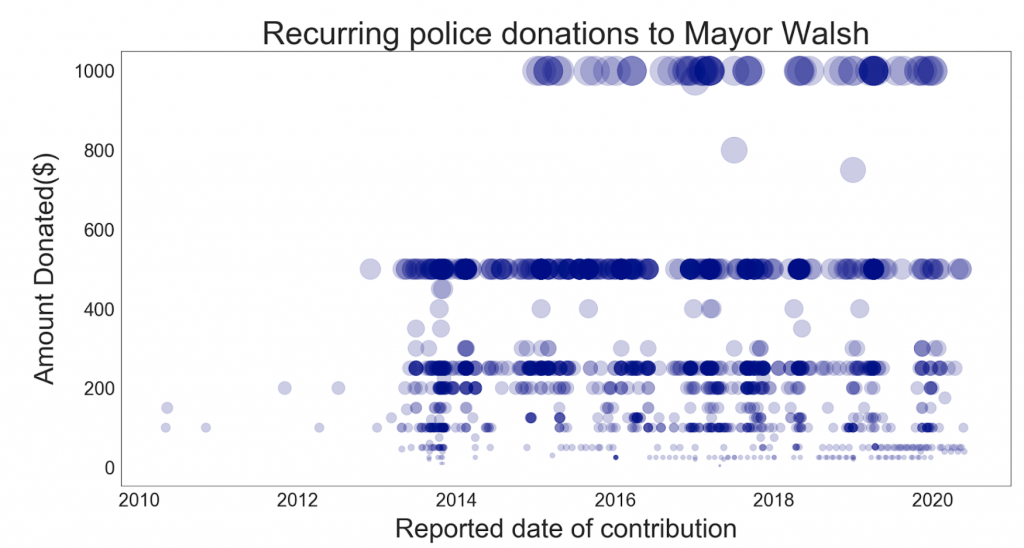
Individual and PAC/Union Police Contributions to Mayor Walsh, 2010-2020
Visualization by BU Spark!
The data shows that Mayor Walsh receives a steady stream of police donations month after month, year after year. This includes large and small amounts in contested election years as well as off-years. Mayor Walsh maintains a median police-related donation of as much as $250 across a total of 1477 donations for the last ten years of data.
Police contributions to the Walsh campaign align to the campaign’s general fundraising pushes. As you can see below, contributions from police have historically peaked around the same time that Walsh’s overall fundraising peaked.
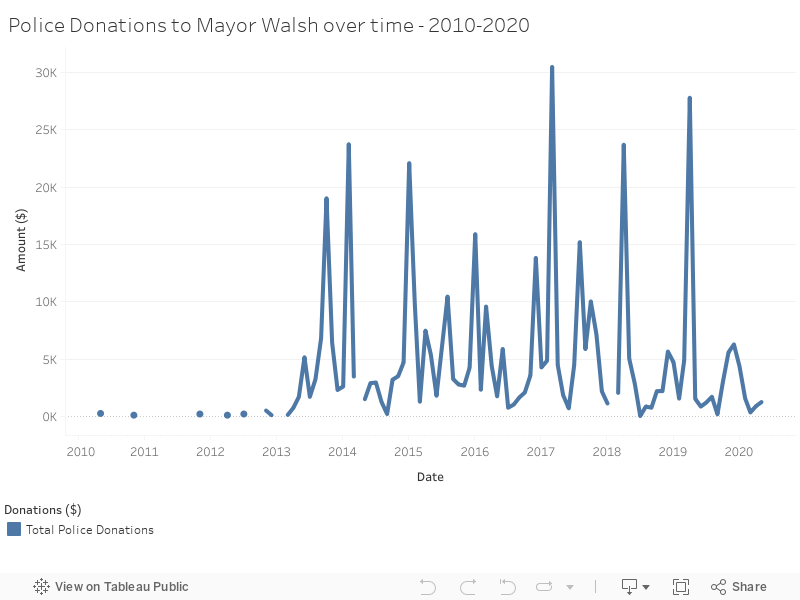
Police contributions to Mayor Walsh over time, 2010-2020
Visualization by BU Spark!
Where do the police who have donated to Mayor Walsh live? While many police donors to the Walsh campaign live in Boston, the data shows that many others live in cities and towns across Eastern Massachusetts.
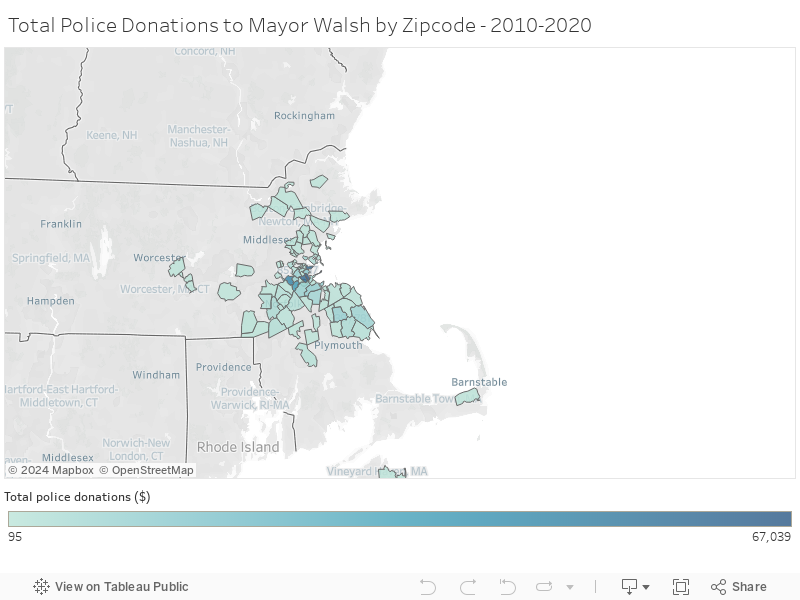
All police contributions to Mayor Walsh by zip code, 2010-2020
Visualization by BU Spark!
The top three most profitable zip codes for police contributions to the Walsh campaign are in Boston, including 02122 (Dorchester-Neponset/Port Norfolk, total: $68,589), 02124 (Dorchester-Ashmont/Lower Mills/Codman Sq, total:$58,961), and 02127 (South Boston, total: $57,375). Yet overall, 26% of the Mayor’s police-related campaign support came from residents outside of Boston, whether BPD employees or not.
Police contributions to Boston City Councilors
Mayor Walsh isn’t the only Boston politician with strong, consistent financial backing from police. Police contributions to currently serving Boston City Councilors in the last decade totaled $114,276—approximately one fourth of the total police support to Mayor Walsh. Councilor Michael Flaherty, who has served on the council as a Councilor At-Large since 2000, tops the list. Police contributed $38,700 to Councilor Flaherty in the years 2010-2020.
Police-related contributions to Councilors vary widely. Some councilors received tens of thousands of dollars from police and some received just hundreds. And two councilors newly elected in 2019—Councilors Kenzie Bok and Liz Breadon—have not received any police-related contributions.
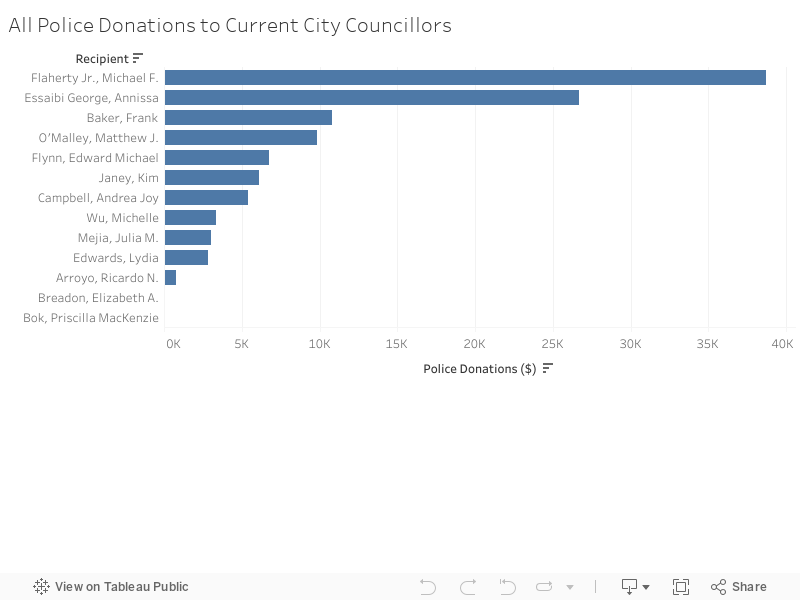
Individual and PAC/Union Police Contributions to Current City Councilors, 2010-2020
Visualization by BU Spark!
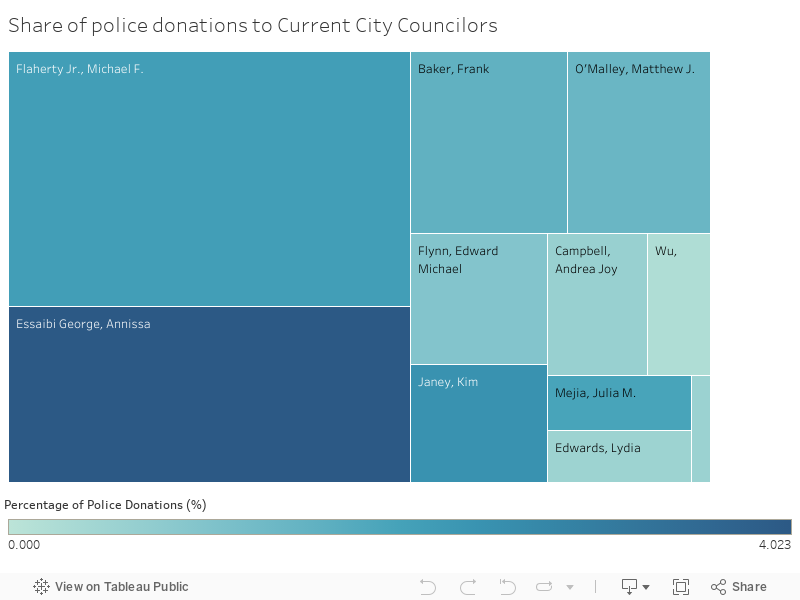
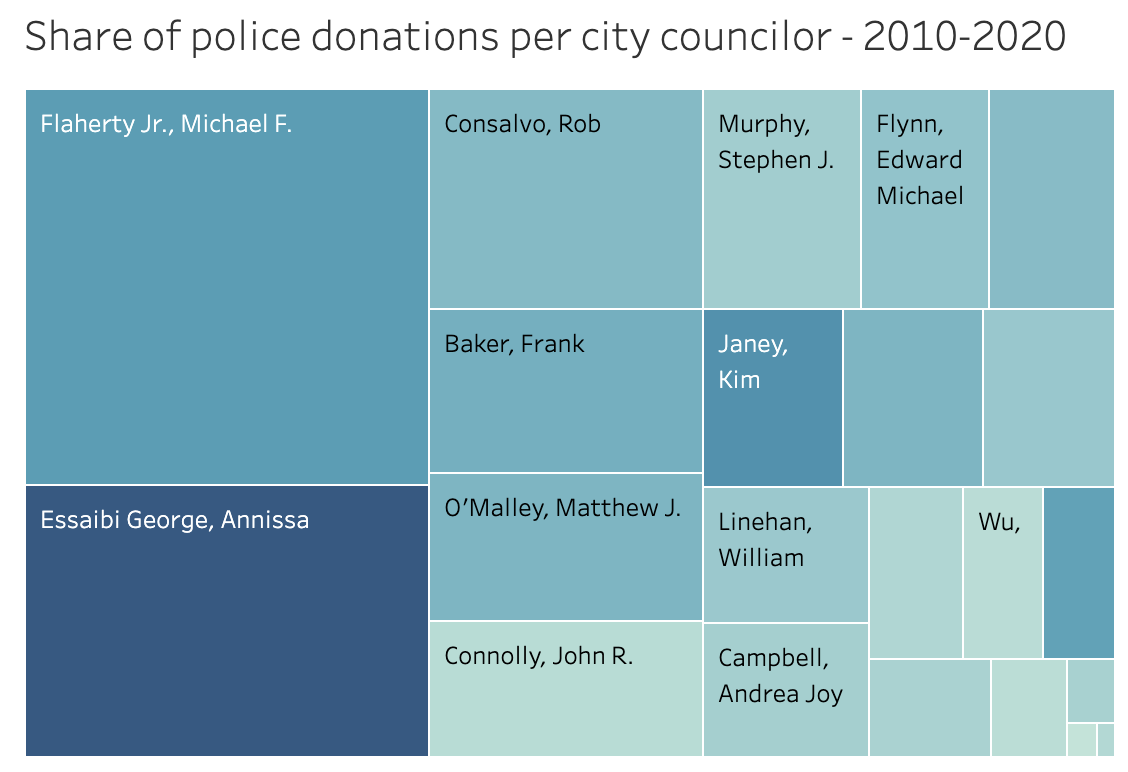
Amount (size) and percent (color) of Police Contributions to Current City Councilors, 2010-2020
Visualization by BU Spark!
In the above visualization, the darker the color of a Councilor’s rectangle, the higher the percent of total contributions made to that Councilor by police. The larger the block, the greater the total police contribution amount. Councilor Flaherty leads in total financial support while Councilor Essaibi George leads in percentage of contributions coming from police.
Councilors Flaherty and Essaibi-George jointly account for a bit over half (56%) of police contributions. As a share of total contributions, Flaherty received 2.13% from police. Councilor Essaibi-George has served a shorter period, though her share of police donations is larger at 4%. Councilors with the smallest share of police donations include Councilors Wu (0.23%), Edwards (0.52%), Arroyo (0.54%) and Campbell (0.60%).
For many reasons, police nationwide have outsized influence on local and state politics. As concerned community members, we must ensure government officials are held accountable to all of their constituents, not just those with the most money or political clout.
Learn More:
- Explore the OCPF political donation data
- Follow news about Boston’s police unions role in local politics. Here is one important report. Boston police have been outspoken in their opposition to the Movement for Black lives and to political leaders who provide support
- Check out this recent USA Today article highlighting the unchecked political influence of police and police unions across the country
Take action:
- Sign up for project partner BU Spark!’s newsletter to learn more about BU student tech projects
- Sign on and support project partner Mijente.org on the front lines in Latinx communities for social and criminal justice
- Join to become a card carrying member of the ACLU of Massachusetts
- Learn how to file a complaint against the Boston Police: https://openpolice.org/dept/MA-boston-police-dept
To learn more or get involved with the Police in Politics project, please email police-in-politics@aclum.org.
The Police in Politics project is a partnership between Mijente, BU Spark!, and the ACLU of Massachusetts to investigate police donations to Massachusetts politicians. It is supported by some great technical volunteers, including Steve Backman.
Boston City Council Hearing on Proposed Ordinance to Ban Face Surveillance
![]()
Boston City Council Hearing on Proposed Ordinance to Ban Face Surveillance
On June 9, 2020, the Boston City Council's Committee on Government Operations held a hearing to discuss Councilor Michelle Wu and Councilor Ricardo Arroyo's proposed ordinance to ban face surveillance in Boston's municipal government. Dozens of advocates, academics, and community members testified at the hearing.
Below is a sample of some of the written testimonies submitted in support of banning face surveillance in Boston.
Organizations
National Lawyers Guild - Massachusetts Chapter
Surveillance Technology Oversight Project
Boston Public Library Professional Staff Association
Electronic Frontier Foundation
Academics, advocates, and community members
Woodrow Hartzog and Evan Selinger
Unpacking the Boston Police Budget
Explore all of the ACLU of Massachusetts' analysis on policing in the Commonwealth.
In response to the recent egregious murders of George Floyd, Breonna Taylor, Ahmaud Arbery, and Tony McDade, and the nation has seen historic numbers mobilizing and protesting the anti-Black criminal legal system. Advocates across the country have intensified their calls for the government to take action against police abuse, with suggested responses spanning from large-scale defunding to total disbandment of police departments.
Here in Boston, substantial pressure is building to #DefundPolice. Due to monumental organizing efforts by groups such as the Muslim Justice League and Families for Justice as Healing, the Boston City Council received an unprecedented amount of public feedback urging defunding for the June 4 hearing on external grants funding the Boston Police Department (BPD).
Yet these external grants, totaling $2.6 million, are small potatoes compared to the full $414 million the City of Boston has proposed to fund the BPD in Fiscal Year 2020-2021 (FY21), and that the Boston City Council is slated to approve on Wednesday, June 10. Here the ACLU of Massachusetts presents a detailed analysis of how the Boston Police department uses its outsize share of taxpayer dollars.
Access and share this blog published in the form of a report here.
How much money does the BPD get?
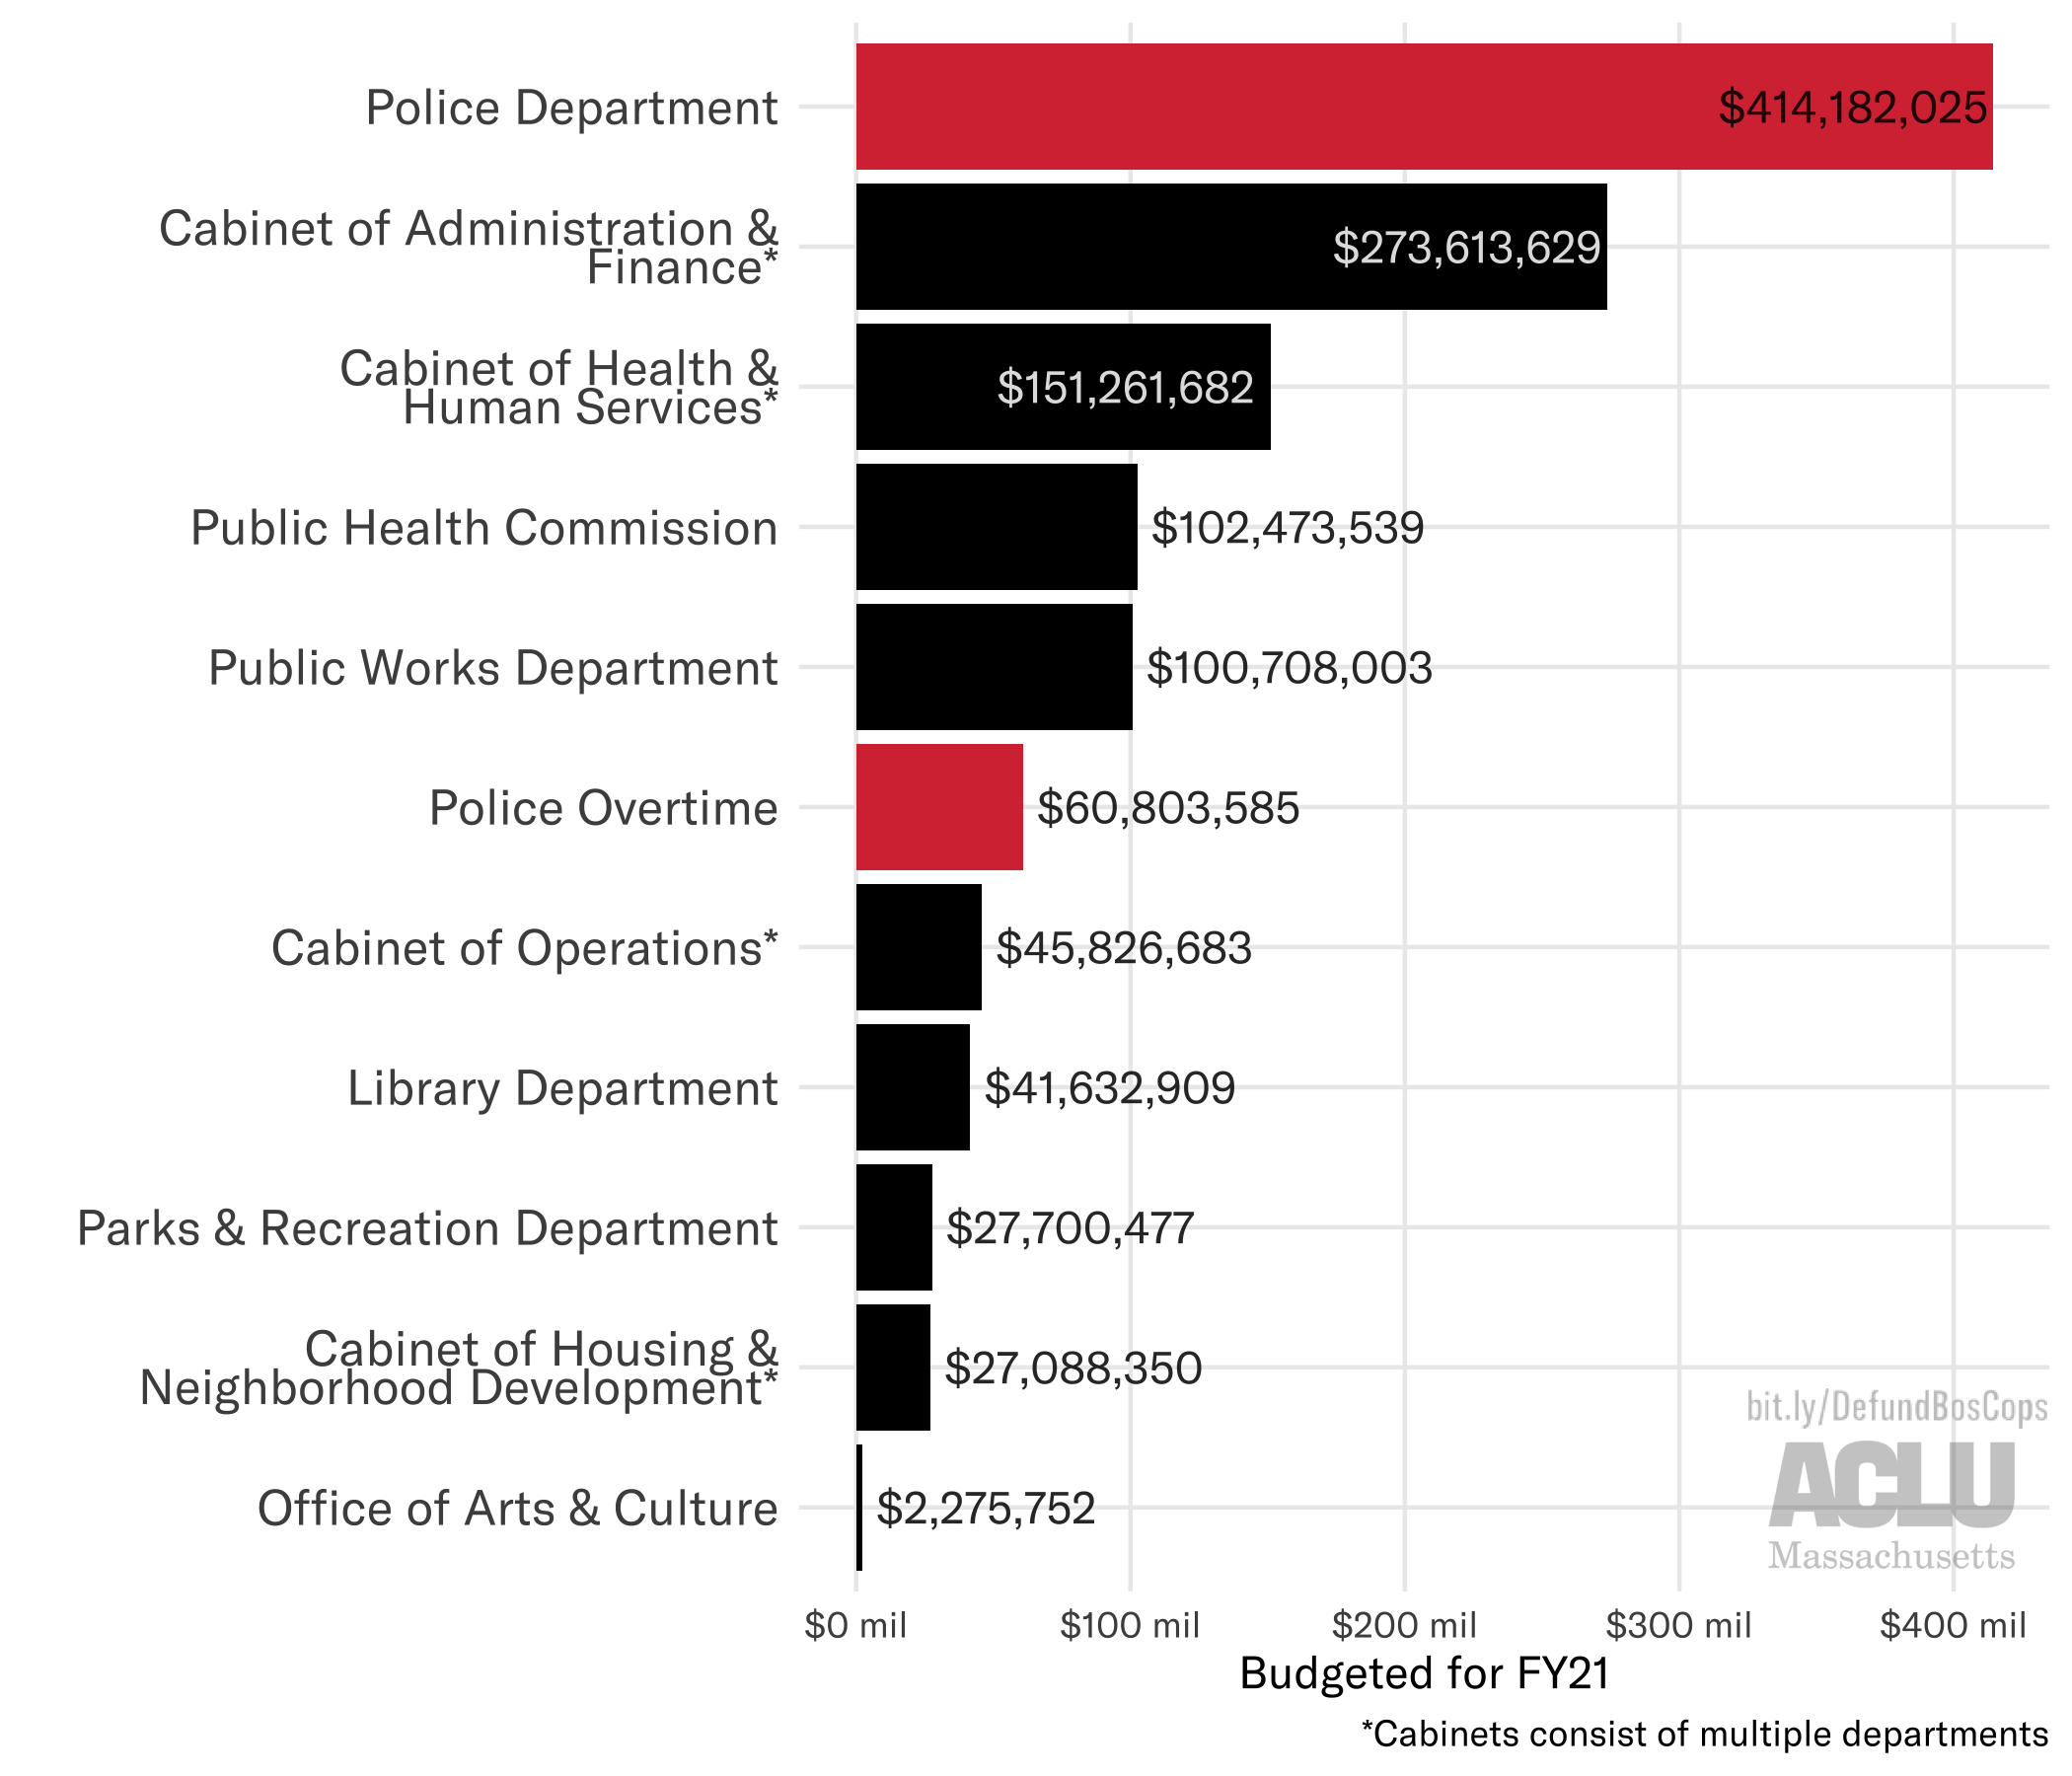
The Boston Police Department budget dwarfs that of not only other City departments, but of entire City cabinets (where cabinets administer multiple departments). The FY21 budget proposes a $414 million budget for the Boston Police Department – the second largest line item in the entire city budget, second only to Boston Public Schools.

Compared to the budgets of other Boston City departments (and cabinets), the Boston Police budget is:
- 1.5x larger than the Cabinet of Administration and Finance (which constitutes 17 individual departments)
- 2.7x larger than the Cabinet of Health and Human Services (which constitutes 9 individual departments)
- 4x larger than the Public Health Commission
- 10x larger than the Library Department
- 15x larger than the Neighborhood Development Department
- 182x larger than the Office of Arts & Culture
Especially given that we continue to face the worst global pandemic in a century, with no vaccine in sight, the fact that the Boston Police Department expects to receive four times the funding of the Boston Public Health Commission is simply unconscionable.
It’s also important to note that the BPD funding is not limited to what is adopted in the City of Boston’s operating budget. Funding to Boston’s separate Office of Emergency Management and other state and federal grants further deepen the BPD’s proverbial pockets.
What is the FY21 budget changing?
Compared to FY20, the total amount of the BPD budget for FY21 is essentially unchanged. However, funding for personnel is being quietly reallocated within the budget in concerning ways.
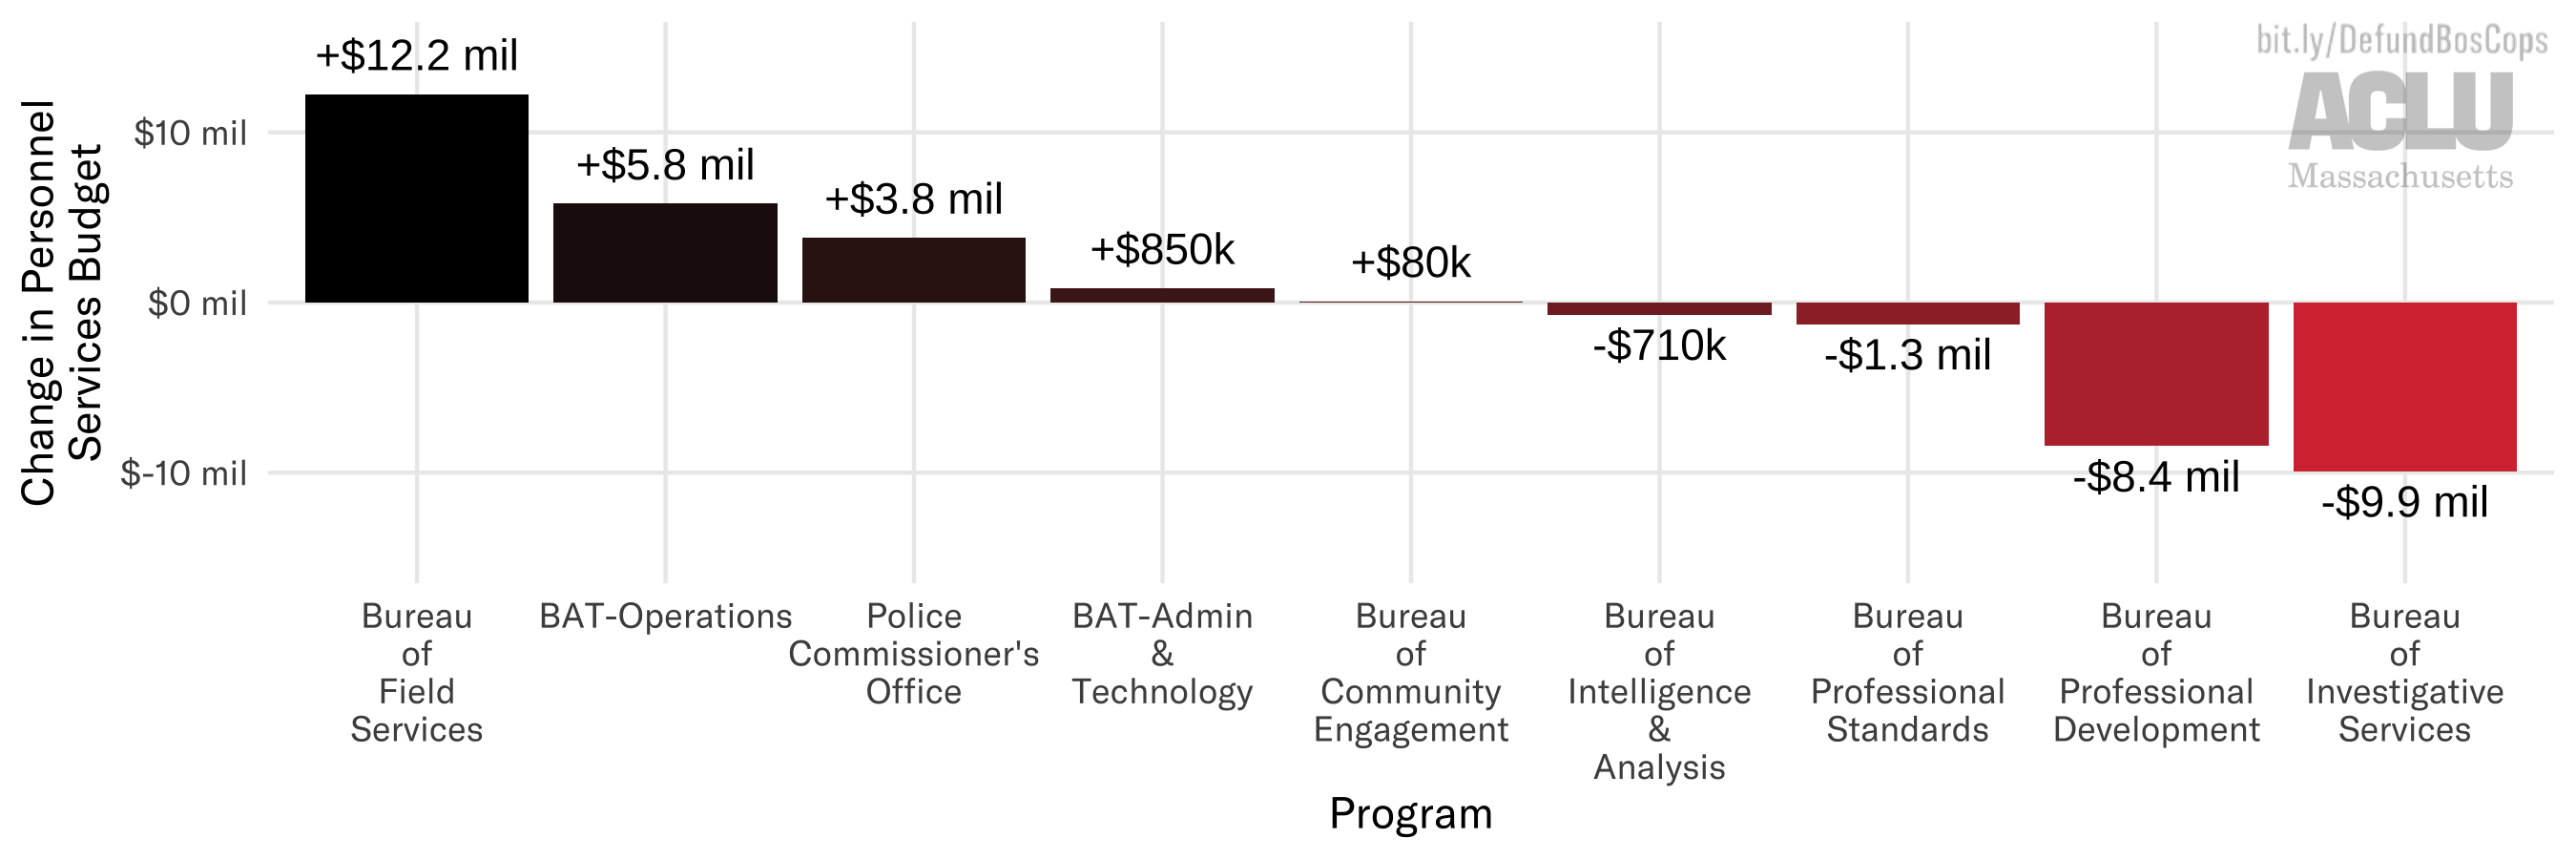
Comparing the different programs within BPD, the Bureau of Field Services is seeing a $12.2 million increase in personnel funding in FY21. This increased funding supports hiring 25 new officers, as well as raises and bonuses for existing officers. At the same time, the Bureau of Professional Standards and the Bureau of Professional Development see personnel cuts of a cumulative $9.7 million.
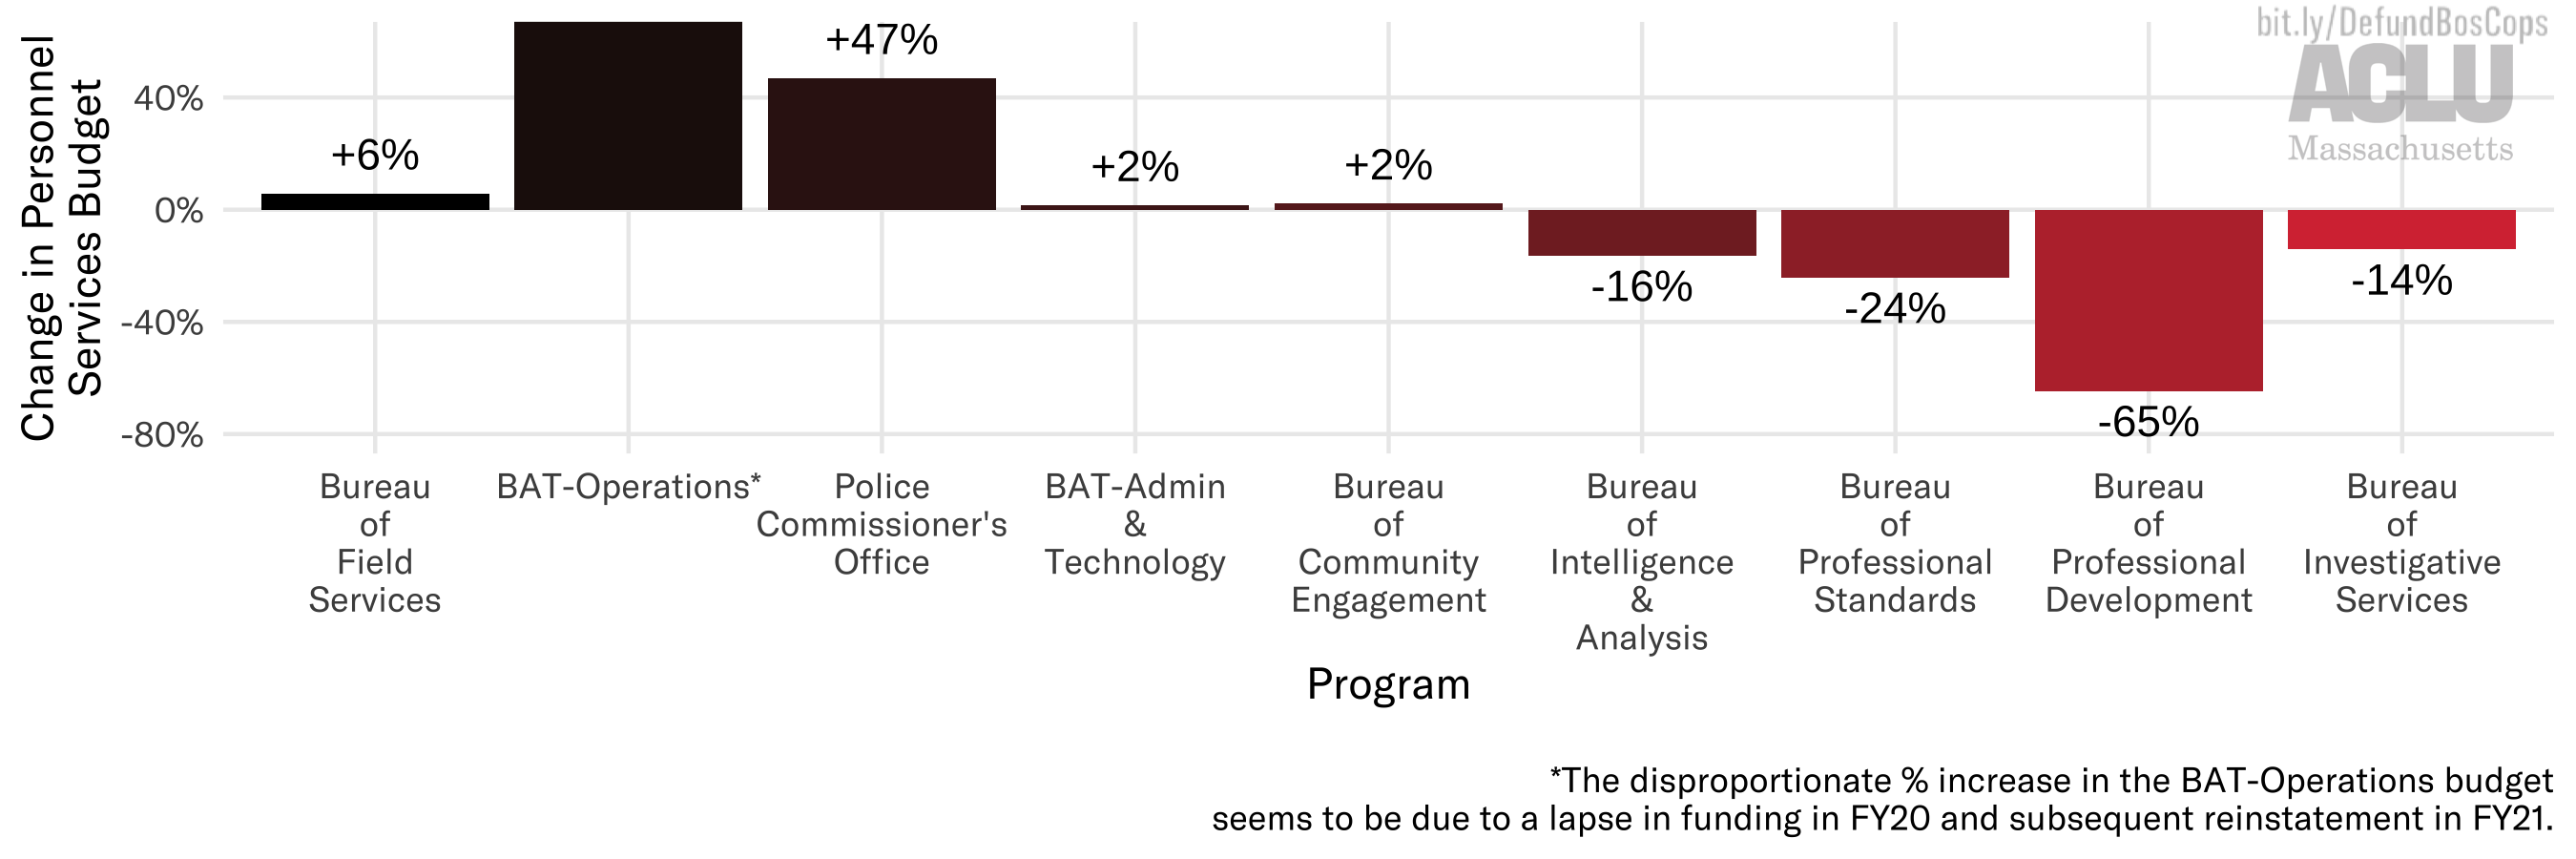
Looking at these raises and cuts as percentages of the FY20 personnel budgets, it becomes clear just how massive these cuts to the professional bureaus are – constituting 24% of the FY20 budget for the Bureau of Professional Standards and 65% of the FY20 funding for the Bureau of Professional Development.
What exactly do these bureaus do? The Bureau of Professional Standards includes the BPD’s Anti-Corruption Division and its Internal Affairs Division; the Bureau of Professional Development includes the Police Academy and Firearms Training programs. Simply put, the BPD programs focused on ensuring professionalism and accountability are being slashed.
How much do BPD employees get paid?
Beyond scrutinizing the City’s funding of the BPD, it is also prudent to examine how these funds are distributed to the Department’s employees, and how BPD’s compensation compares to that of other City officials.
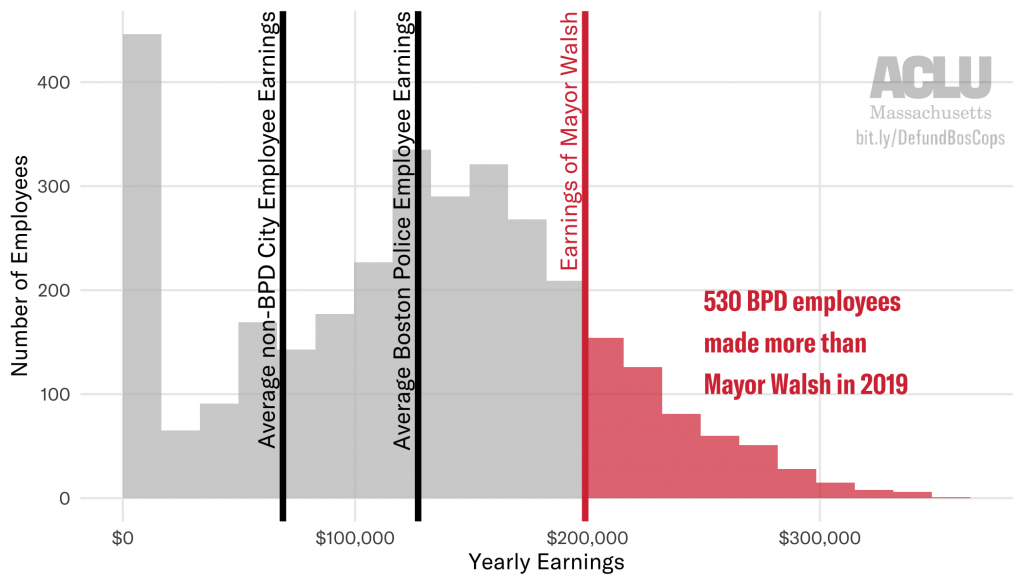
Employee earnings from 2019 show that BPD employees have some of the highest earnings in the entire City of Boston. Indeed, in 2019 the average BPD employee’s yearly earnings were $127,000, while the average non-BPD City employee’s yearly earnings were $69,000 – a whopping difference of $58,000.
Even Boston’s Mayor Marty Walsh can’t compete – 530 BPD employees made more than the mayor’s $199,000 earnings in 2019. All in all, in 2019 BPD employees made up 15 of the top 20 highest-paid Boston employees.
And, concerningly, the vast majority of high-earning BPD employee’s pay seems to come from sources other than their base salary.
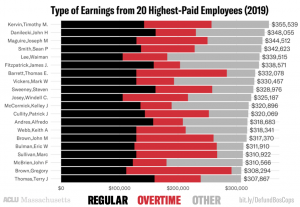
None of the highest-earning BPD employees received over 60% of their income from base salary (regular) wages. Overtime, detail, and unspecified “Other” pay categories massively buffer their earnings.
Altogether, the 20 top BPD earners took home $1,971,778 in overtime pay in 2019.
For a great interactive chart showing the earnings of the almost 3,000 people on the BPD payroll, check out this public data viz by Dawn Graham.
What’s that about overtime?
The Boston Police Department estimates its employees will use over 1,200,000 hours of overtime in 2020. Spread over a 52-week year and a workforce of 2898 full-time equivalents (FTEs), 1.2 million hours breaks down to:
- 23,500 overtime hours BPD-wide per week
- 420 overtime hours (2.5 months) per BPD employee per year
- The equivalent of hiring over 570 new full-time employees
And at $60.8 million, the BPD overtime budget makes up 15% of the entire BPD budget. When compared with other Boston City department budgets, the BPD overtime budget alone is:
- 1.3x larger than the Cabinet of Operations (which constitutes 3 individual departments)
- 2x larger than the Parks & Recreation Department
- 11x larger than the Mayor’s Office
- 15x larger than the Cabinet of Civic Engagement
- 240x larger than the Human Rights Commission
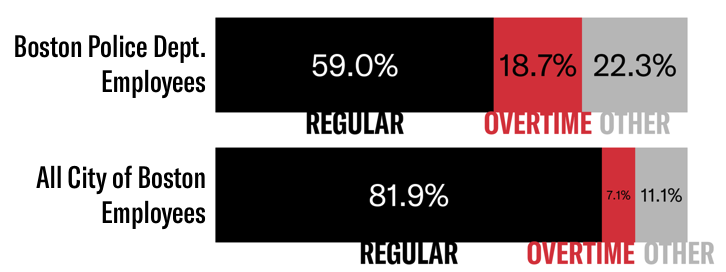
This trend is not typical among Boston City employees. Just 7.1% of the earnings of all City of Boston employees were categorized as overtime, yet 18.7% of the BPD earnings came from OT.
This exorbitant overtime pay comes from a number of city and state policies, including an effective monopoly on police operating details at construction sites and a required four-hour minimum pay for any appearance in court.
And what’s more, the BPD have been repeatedly caught fraudulently abusing overtime pay – in 2012, 2016, and 2019.
Where do these data come from?
The data we present here are collected from a number of sources:
- Boston City Council documents
- Packet submitted to the Boston City Council by the BPD in advance of the budget hearing
- Boston City budget website
- Overview of proposed citywide FY21 operating budget
- Boston public safety cabinet (including the office of emergency management, fire department, and police department) adopted FY18-20 and proposed FY21 budget, including line items by accounts payable, list of department personnel & salaries, and list of external funds
- Boston’s open data portal
- Proposed and adopted operating budgets from 2018-2021, broken down by cabinet, department, and program
- City of Boston 2019 employee earnings report
What to do about it
We encourage you to read through the Muslim Justice League’s Defund Boscops Toolkit where they lay out strategy for defunding the Boston Police, including detailed sample testimony.
Some immediate political actions include:
- Call or email Boston Mayor Marty Walsh and Boston City Councilors on the Ways and Means Committee before the final budget vote on Wednesday, June 24, urging them to reject and reduce the current budget’s inflated funding of the BPD
- Tell your Massachusetts legislators to defund police and invest in communities
- Sign a petition to defund Boston police, run by the Youth Justice and Power Union, Roxbury Environmental Empowerment Project, and The City School
- Get involved with a statewide movement to #DefundPrisons with this fantastic toolkit from Families for Justice as Healing and the Building Up People Not Prisons Coalition
Systemic police abuse against Black Americans and peaceful protestors is enabled by massive, unchecked police funding – exactly what we see in the City’s budget for the Boston Police Department.
Now more than ever, we must hold cities, states, and police departments accountable by publicizing the contents of their pocketbooks and urging our legislators to divest and #DefundPolice.
This report and analysis was authored by Lauren Chambers (ACLUM) with the guidance of Kade Crockford (ACLUM) and Fatema Ahmad (MJL).
A previous version of this blog incorrectly cited the final Boston City Council budget vote as being on June 10th. It is actually on June 24th.
Internet Deserts Prevent Remote Learning During COVID-19
Across the country, closures due to COVID-19 are forcing families and schools to take extreme measures just to get students to class, because they lack one essential resource: internet access.
From Michigan to Alabama, Pennsylvania to Oregon, school buses are being transformed into roving wi-fi hotspots. Some rural students have no choice but to drive miles to sit in parking lots of fast food restaurants and churches in order to access the internet. In Fort Worth, Texas, a school district bought three transmission towers for $600,000.
Here in Massachusetts, school districts reports show that while wealthy regions like Andover report online student participation around 95 percent, lower income areas like Chelsea are seeing attendance as low as 30 percent.
Many school districts such as Springfield and Chicopee have distributed technology, like laptops and tablets, to students. However, a laptop without internet is just as useful for modern schoolwork as a car without gas is for driving. Without the final piece of the puzzle, it’s just a glorified hunk of metal.
Using data from the Census’ American Community Survey, the ACLU of Massachusetts presents analysis of internet and computer access across the Commonwealth. We show that many urban and rural areas in Massachusetts are “internet deserts”, where access is severely limited.
Learn More: Visit our interactive site which allows detailed exploration of internet access and related social factors across Massachusetts.
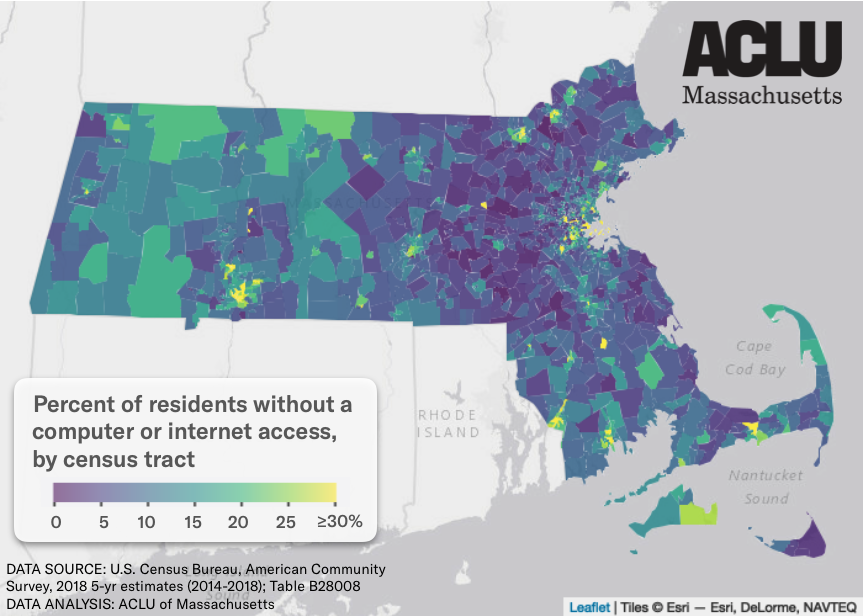
Hotspots without computer or internet access
According to estimates from 2014-2018 census data, over 500,000 Massachusetts residents either do not have a computer or, while having a computer, do not have access to the internet. Statewide, this represents 8 percent of all Massachusetts residents. However, in certain regions in the Commonwealth – so-called internet deserts – over 25 percent of residents, 1 in 4, do not have a computer or internet access.

Massachusetts’ urban areas, including Boston, Lowell, Lawrence, Worcester, Springfield, and Northampton, all have neighborhoods in which over 30 percent of residents live without wi-fi. But rural areas are affected as well: northwestern and southwestern Massachusetts also have large regions where almost 20 percent (1 in 5) of folks don’t have access.
Even more without broadband internet
However, not all internet is created equal. High-speed broadband internet connections, rather than slower dial-up, are necessary for effective use of video conferencing software. Without broadband, remote students may have extra technical difficulties which prevent their participation in school.
Census estimates show that more than 1 million Massachusetts residents, over 15 percent, do not have a fixed broadband internet connection.
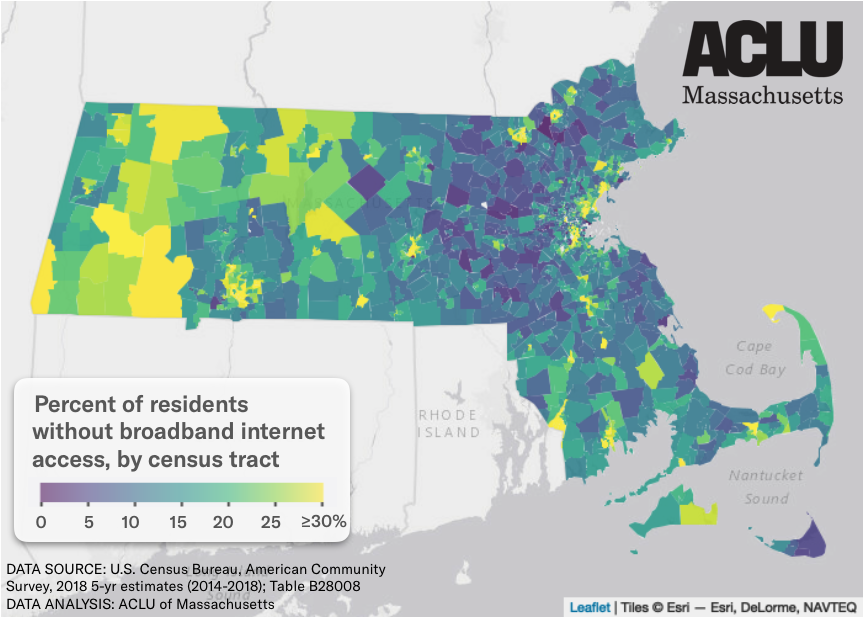
Again, localized areas see much higher rates: all major Massachusetts cities and large swaths of rural Western Massachusetts contain regions where over 30 percent of residents have no reliable broadband wi-fi.
Low-income areas are the most disconnected
Of course, unequal access arises from the fact that internet subscriptions cost money. Census analysis shows that internet and computer access correlate with income, such that areas with higher income communities enjoy more widespread access, while lower income neighborhoods are disproportionately left unconnected.
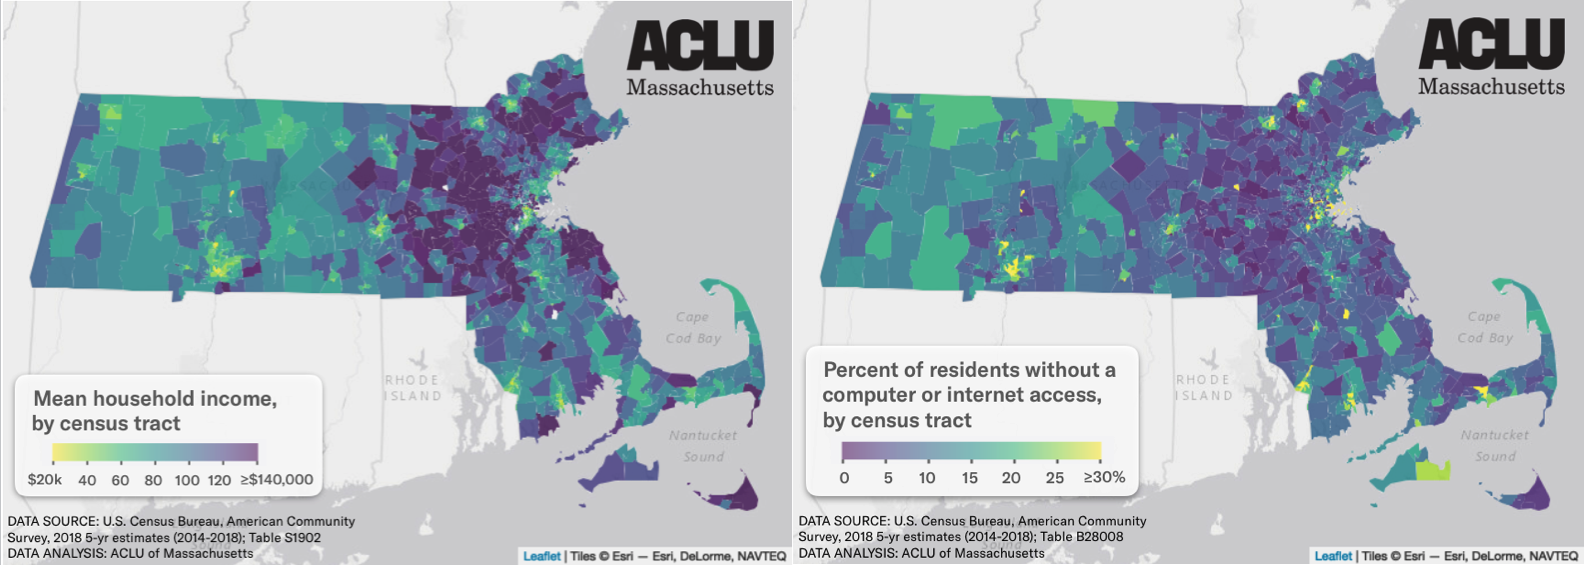
In the extreme era of COVID-19, it’s important to note that this analysis uses income estimates from up to only 2018. The global economic downturn and widespread job losses caused by the pandemic mean that many households are now earning much less than they did in 2018, and thus presumably even more households are going without wi-fi.
Tens of thousands of students offline
Further analysis breaking down estimates of internet access by age reveals that over 60,000 people under the age of 18 in Massachusetts, around 4 percent of all minors, have no computer or internet access at home.
Indeed, in multiple school districts across the state more than 20 percent of minors have no access to wi-fi, including those already shown to be located within internet deserts: Springfield, Lowell, Lawrence, and Petersham School Districts (Worcester).
What about your town?
Use this interactive map to explore internet access and income across Massachusetts:
As the ACLU of Massachusetts emphasized in a recent letter to the Commonwealth’s Department of Elementary and Secondary Education (DESE): unequal education isn’t just unacceptable; it’s unlawful.
DESE must take action to increase resources in low income school districts. Some individual districts, including Amherst, Chicopee, and Holyoke have set examples by providing mobile hotspots to families and securing deals with internet providers to get students free access. Now the state, too, must step up to ensure all students have access to not only computers and tablets but all of the following as well:
- Functional microphones and webcams
- Broadband internet supportive of remote video meetings
- Hardware and infrastructure required for an internet connection (e.g. cable line, modem, & router)
- Communications platforms free of charge
- Assistive technology including but not limited to screen readers, live closed captioning, and speech-to-text software for students with disabilities
- Software and websites compliant with the Web Content Accessibility Guidelines (WCAG)
- Privacy assurances for all software and devices
- Instructions written in plain English and appropriate non-English languages, such that students’ families understand and can support remote learning efforts
The Massachusetts Constitution requires that the Commonwealth provide adequate education to all students. And while remote learning is certainly a necessary measure in promoting public health, the current state of affairs means far too many Massachusetts students are now home without even the basic infrastructure for academic participation.
Incarcerated and in Danger: COVID-19 in Massachusetts Prisons & Jails
While the COVID-19 pandemic poses a massive threat to the general population, imprisoned populations face even higher risks due to close living quarters, poor hygiene, and inadequate medical attention.
On April 3, 2020, the Supreme Judicial Court of Massachusetts (SJC) in Committee for Public Counsel Services (CPCS) v. Chief Justice of the Trial Court, SJC-12926 issued an order that will help some incarcerated people in Massachusetts seeking release in response to the threat of COVID-19. Per its decision, the Court now allows some people detained pre-trial to request a hearing for their release where they will be entitled to a rebuttable presumption of release. The Court also ordered daily reports from prisons, jails, and houses of corrections across the state.
Each day, these reports document how many COVID-19 tests are performed on prisoners and staff, how many tests return positive, and how many people are released from confinement pursuant to the Court’s decision. Analysts and developers at the ACLU of Massachusetts have developed a new interactive tracking portal to make these data available to the public and perform preliminary analysis of trends.*
Here we present four major takeaways from the first week of reports, illustrating that Massachusetts prisoners already face an exceptional threat due to COVID-19.
1. COVID-19 cases are skyrocketing in prisons and jails
Statewide, the number of positive COVID-19 cases inside prisons and jails is increasing at a terrifying rate. In just one week, the total number of reported positive cases increased over 200 percent, from 93 prisoners and prison staff who had tested positive by April 6 to 281 positive tests by April 14.
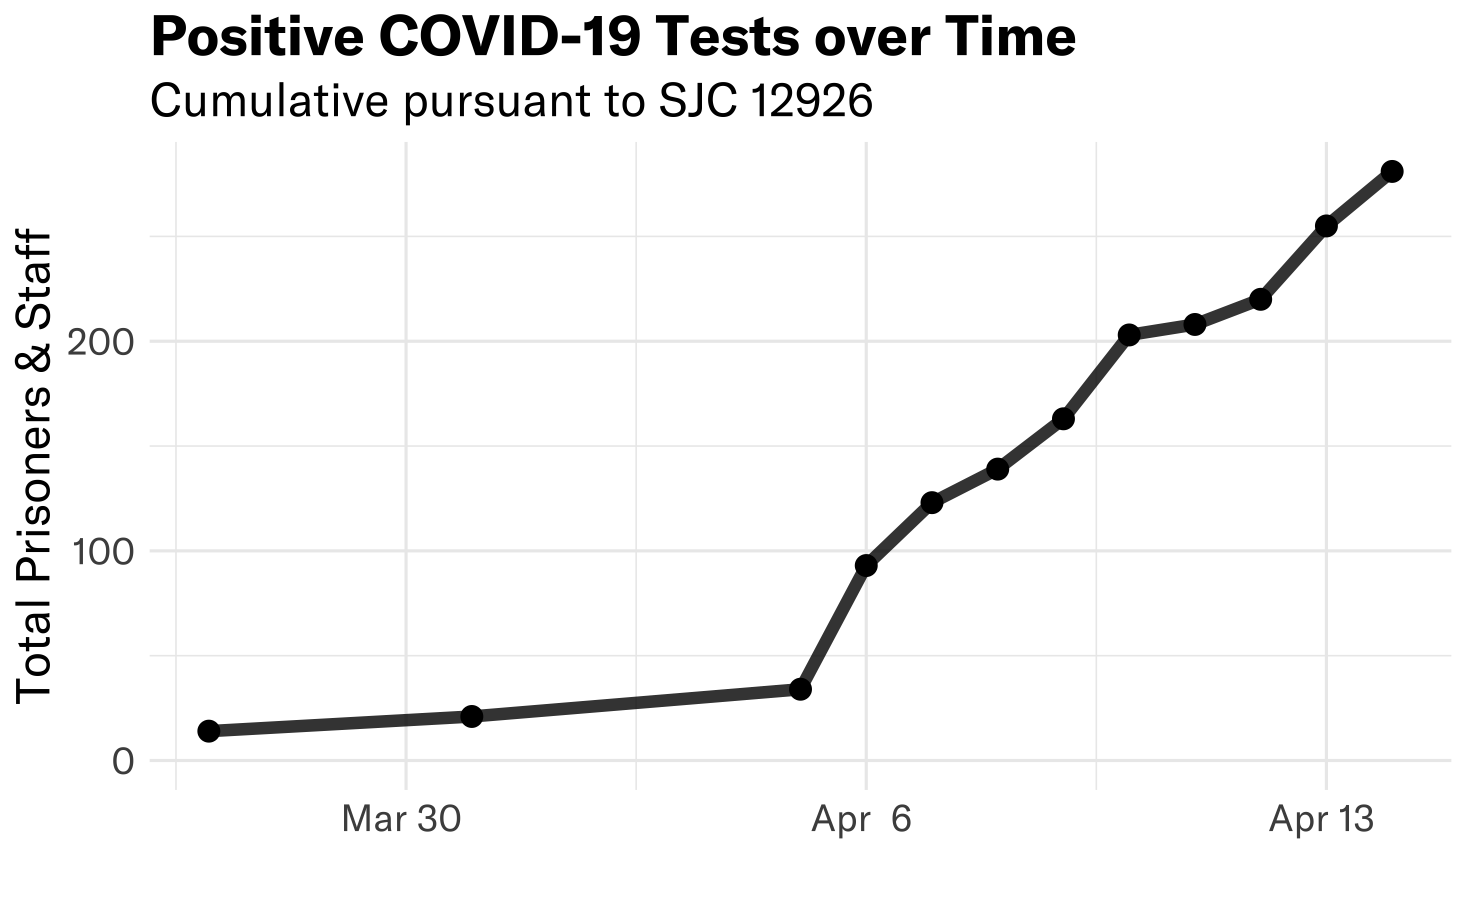
State Department of Correction (DOC) facilities alone account for 62 percent of all cases, reporting 158 positive cases by April 14.
Certain individual facilities have become frightening hotspots, too, with positive cases in Essex County increasing 375 percent from 9 cases on April 6 to 43 cases on April 14. And at the Massachusetts Correctional Institution in Framingham, over 10 percent of prisoners have tested positive for COVID-19.
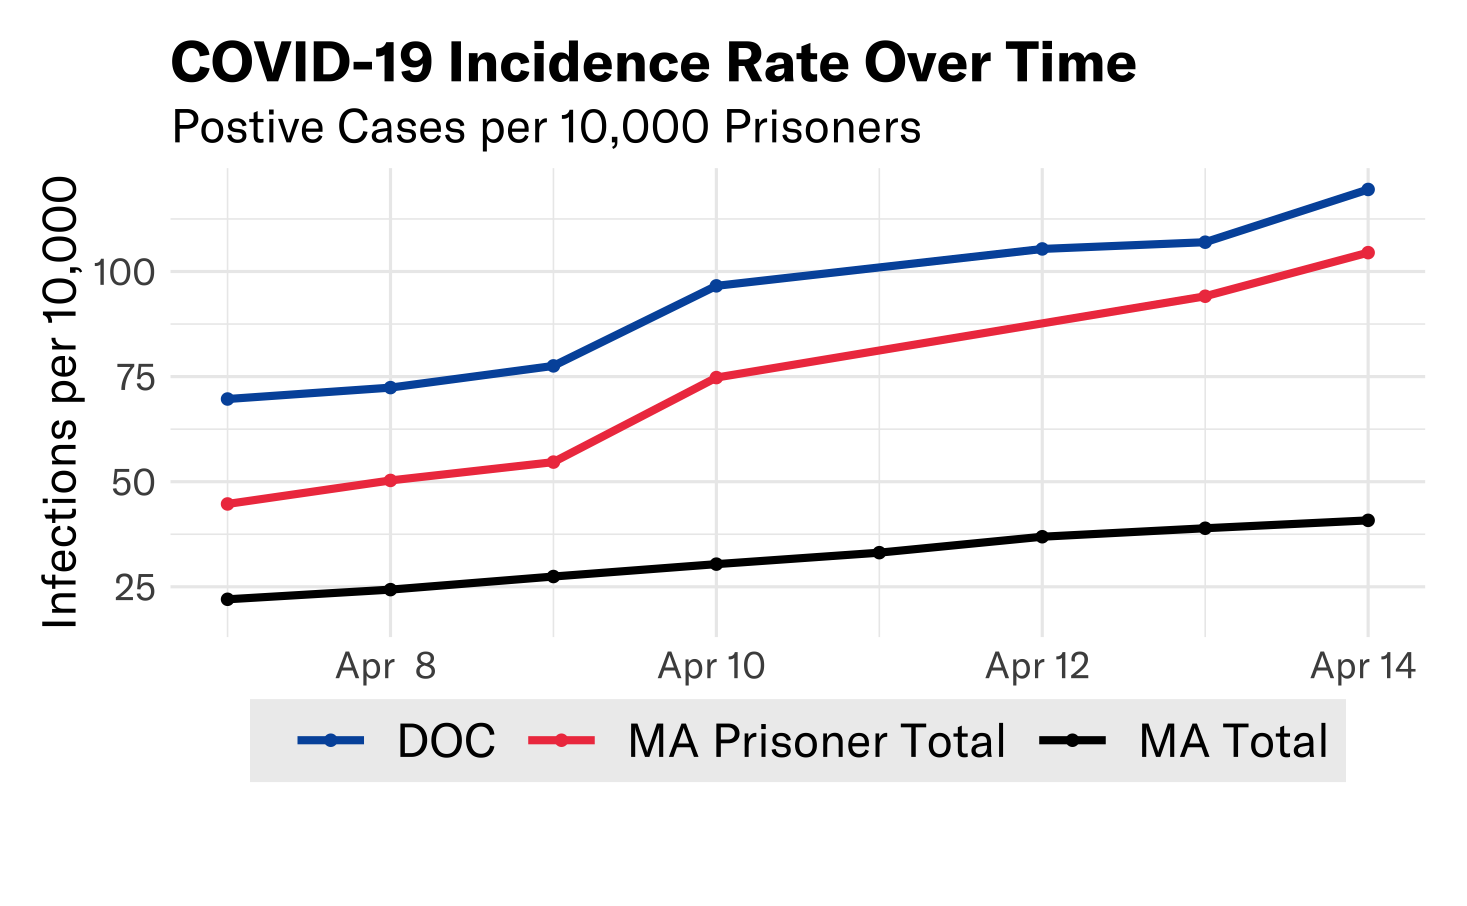
2. Rates of COVID-19 inside prisons and jails are much worse than statewide
As of April 14, the COVID-19 incidence rate among all prisoners incarcerated in Massachusetts is 104 reported positive cases per 10,000 prisoners. In DOC facilities, the situation is even more dire, with a case incidence rate of 120 reported positive cases per 10,000 prisoners.
For comparison, on April 14 Massachusetts reported a statewide case incidence rate of 41 reported positive cases per 10,000 residents. This means the incidence rate of COVID-19 among prisoners within correctional facilities is over two times higher than the statewide rate.
 Yet looking to criminal justice facilities nationwide, it is clear that things can get much, much worse. According to the Legal Aid Society, the COVID-19 incidence rate at Riker’s Island Prison in New York City was 814 reported positive cases per 10,000 people on April 14.
The meteoric increase of cases in Massachusetts facilities suggest we might reach similarly astronomical numbers soon – unless courts and criminal legal system officials take immediate action.
3. Testing in some MA prisons and jails is abysmal
Access to COVID-19 tests in the United States is insufficient nationwide, and the situation is even worse within Massachusetts county jails.
Multiple county sheriffs have not reported testing a single prisoner for COVID-19 since at least April 5. Such counties include Barnstable and Franklin Counties, whose correctional facilities together incarcerate over 300 people.
Other counties have reported testing at unacceptably low rates: Bristol County has administered a COVID-19 test to just 1 of its over 600 prisoners (0.2%); Norfolk County has tested just 3 of 368 (0.8%); Plymouth County, 4 of 744 (0.5%).
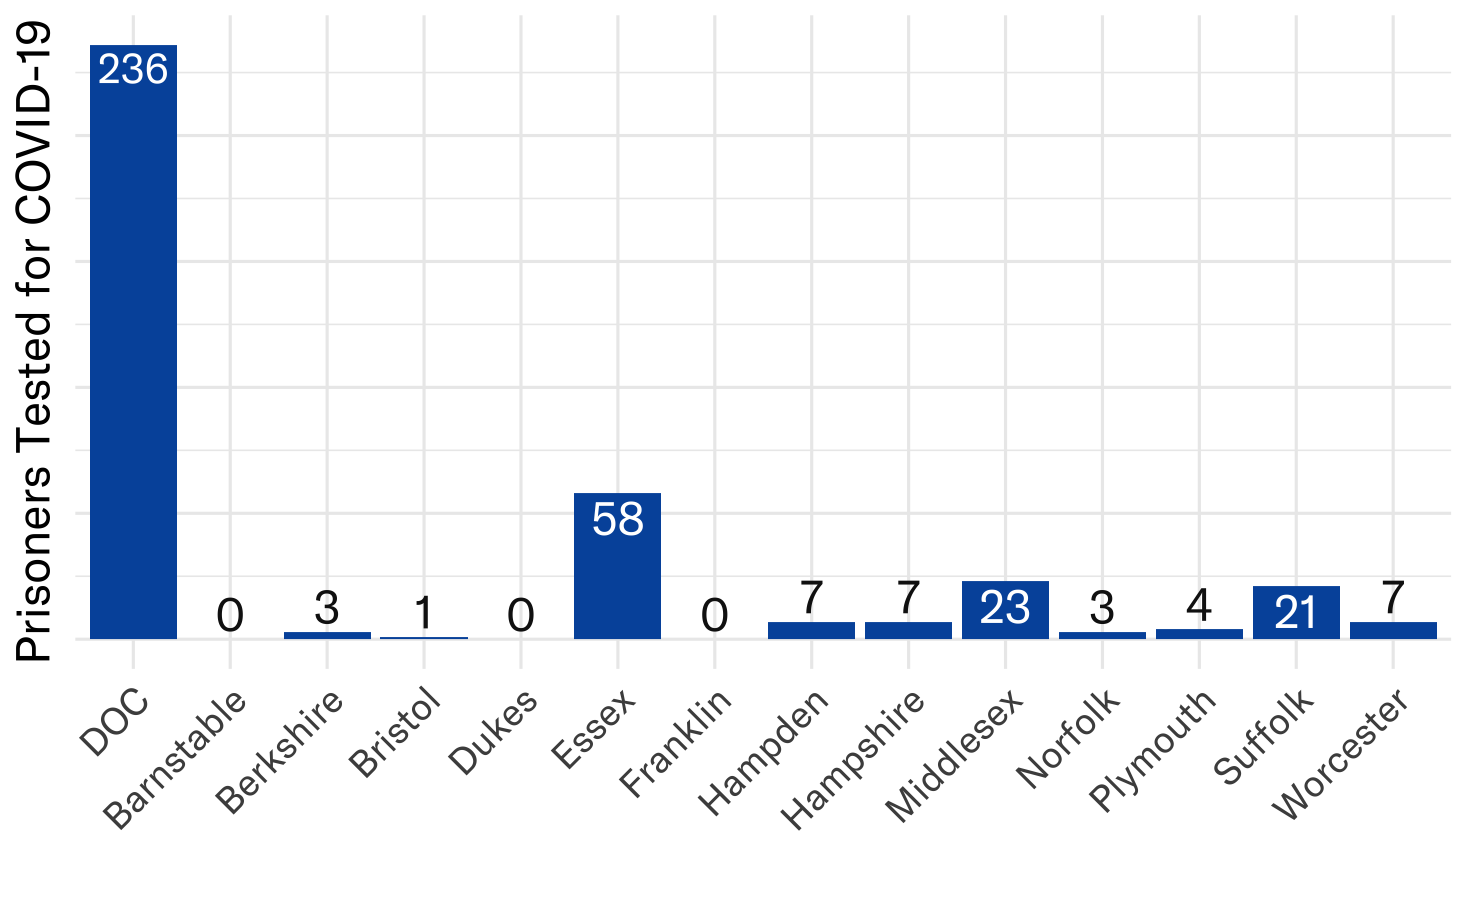
Compare this to testing rates across Massachusetts, where 126,551 tests have been administered as of April 14, for a statewide testing rate of 1.8 percent.
Tests of jail employees, including correctional officers, contractors, and other staff, are lacking as well. Bristol County and Suffolk County have not reported administering a single COVID-19 test to any of its staff, again since at least April 5.
Altogether, the positive rate of tests performed on all prisoners and staff is 49 percent (281 positives from 578 tests). This massively inflated rate reflects not only that COVID-19 is running rampant within prisons and jails, but also that nowhere near enough tests are being performed to inform proactive decisions; these facilities are playing whack-a-mole with prisoners’ and correctional officers’ lives.
4. SJC decision leads to some prisoners released – but not nearly enough
Some good news is that the Supreme Judicial Court decision has indeed led to the release of some people from incarceration. As reported to the Court, 366 prisoners have been released pursuant to the ruling in SJC 12926. Of these, over 80 percent are releases of pre-trial detainees who have not been convicted.
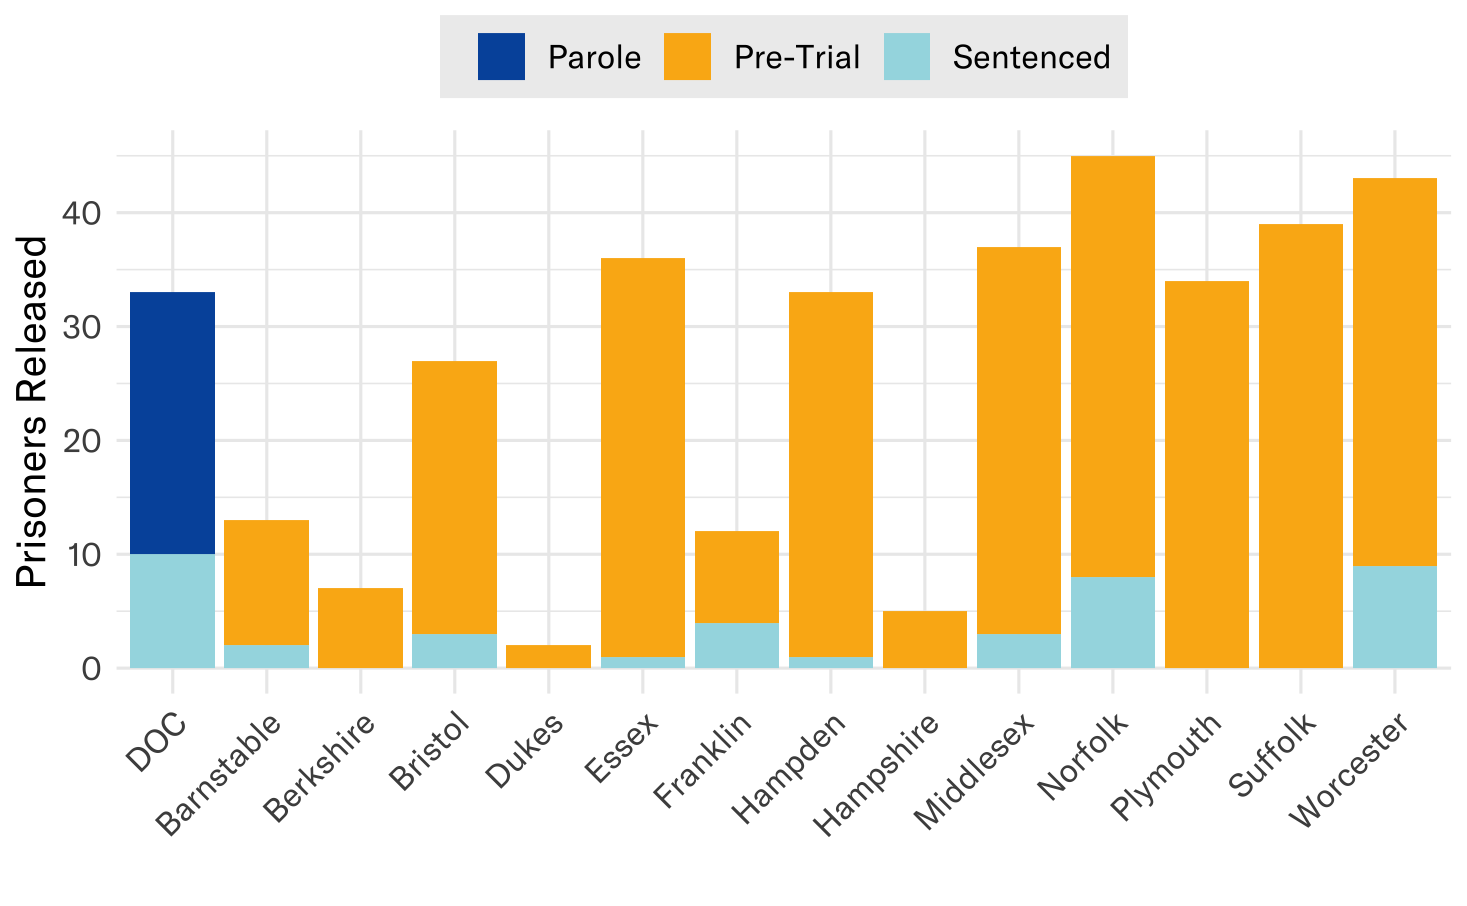
This result is significant for these 366 people and their loved ones. But releasing such a small number of people will not stop the crisis from overtaking our prisons and jails—putting incarcerated people, prison and jail staff, and the entire community at greater risk of infection and death.
This is why, in an open letter to public officials on March 18, the ACLU of Massachusetts urged Governor Baker to grant emergency commutations for “people whose sentence would end in the next year, to anyone currently being held on a technical supervision violation, and to anyone identified by the CDC as particularly vulnerable whose sentence would end in the next two years.” Neither the Supreme Judicial Court nor the governor have acted yet in favor of release for such sentenced prisoners, and only 41 sentenced prisoners have been released.
Governor Baker can and must protect these vulnerable individuals, or they will remain trapped inside increasingly dangerous facilities with no available options for recourse, and many will die.
The best available data on COVID-19 in Massachusetts prisons and jails suggest that many facilities are death traps where inmates and staff alike suffer from skyrocketing rates of infection and insufficient testing.
In a new letter submitted on April 14, the ACLU of Massachusetts and the Massachusetts Public Health Association once again urged the Governor to take action to release incarcerated individuals in the face of pandemic, by (1) ordering the Parole Board to expedite previously-made parole decisions for hundreds of people who have been granted parole but have not yet been released; (2) amending the Executive Clemency Guidelines in light of the pandemic and (3) directing the Advisory Board of Pardons to expedite the processing of pending clemency petitions.
As the Petitioners in CPCS v. Chief Justice of the Trial Court explained in their emergency petition to the Court on March 24, "There are about 16,500 human beings in our prisons and jails. None of them have been sentenced to death. Yet, without aggressive and immediate intervention, COVID-19 will likely kill many of them."
Four prisoners have died of COVID-19 in Massachusetts since that emergency petition was filed. We don’t need to wait for that number to climb higher before declaring a crisis within our prisons and jails. Unfortunately, the data show that crisis is already here. The time to act is now.
*The Special Master in CPCS v. Chief Justice of the Trial Court released a report on April 14th publishing data that conflict with data reported here and in our web tracker. The ACLU of Massachusetts is aware of the disparities, understands their causes, and is in the process of communicating with the Special Master to resolve the issue.
Data show COVID-19 is hitting essential workers and people of color hardest
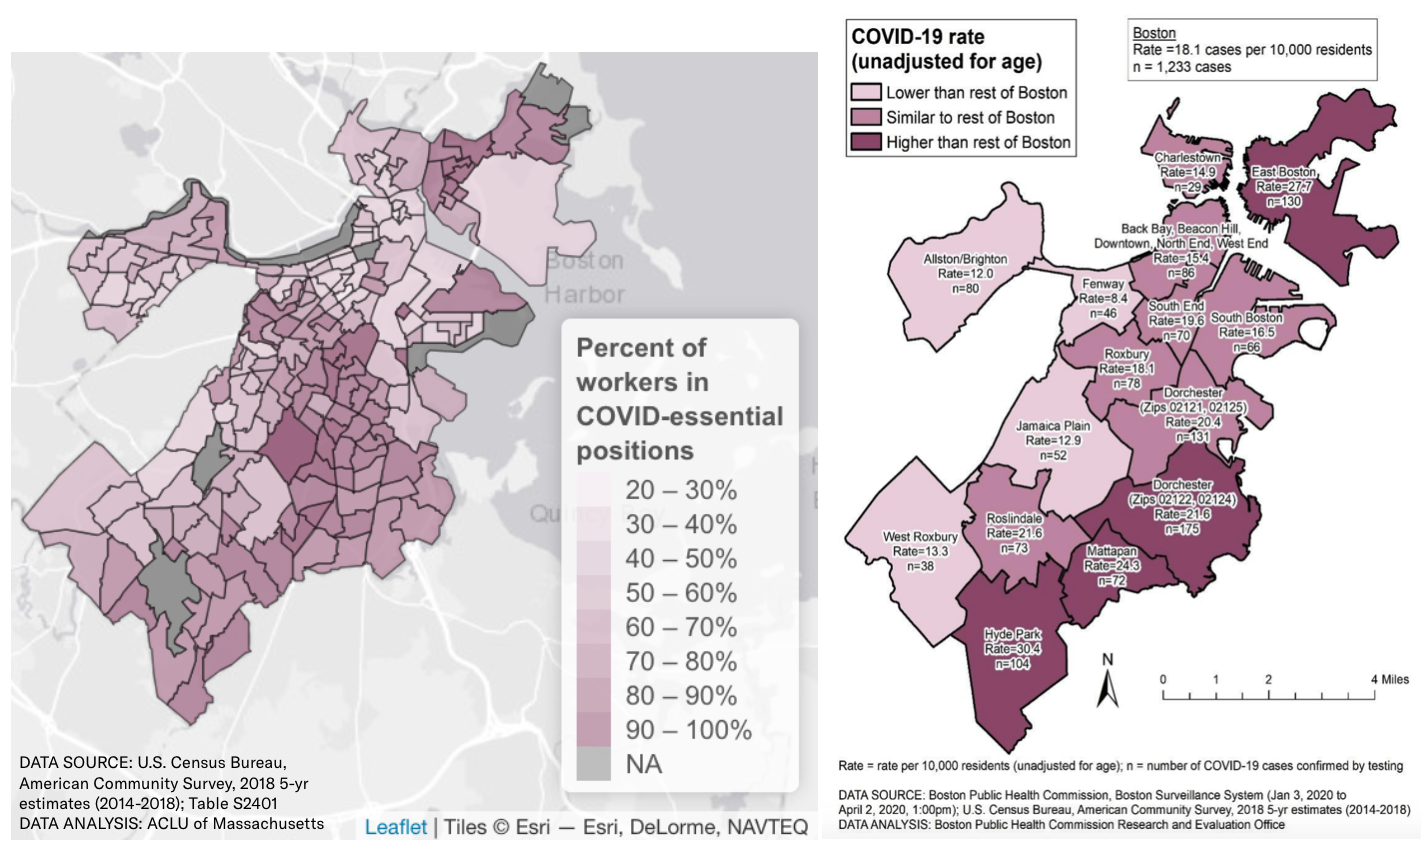
Newly released data from the Boston Public Health Commission (BPHC) show that COVID-19 is present at higher rates in certain Boston communities, including Hyde Park, Mattapan, Dorchester, and East Boston. Analysis presented here by the ACLU of Massachusetts compares BPHC's findings to census data, in order to better understand how the COVID-19 pandemic is affecting Boston’s essential workers and communities of color.
COVID-19 Cases Concentrated Among Boston's Essential Workers
According to the census data, the Boston neighborhoods most impacted by COVID-19 are co-located with the highest proportions of essential workers in the city.
Using data from the U.S. Census 2018 American Community Survey (ACS), we mapped the proportion of workers across Boston who are employed in "COVID-essential" occupations. We defined "essential" occupations to include the following:
- Healthcare practitioners and technical occupations
- Construction and extraction occupation
- Farming, fishing, and forestry occupation
- Installation, maintenance, and repair occupation
- Material moving occupation
- Production occupation
- Transportation occupation
- Office and administrative support occupation
- Sales and related occupation
- Building and grounds cleaning and maintenance occupation
- Food preparation and serving related occupation
- Healthcare support occupation
- Personal care and service occupation
- Protective service occupations

COVID-essential workers are most concentrated in Dorchester, Roxbury, and East Boston – the same neighborhoods where the virus is present at its highest rates.
COVID-19 Cases Concentrated in Boston's Black & Brown Neighborhoods
Similarly, the areas with the most COVID-19 cases align with Boston's communities where people of color make up a majority of the population.
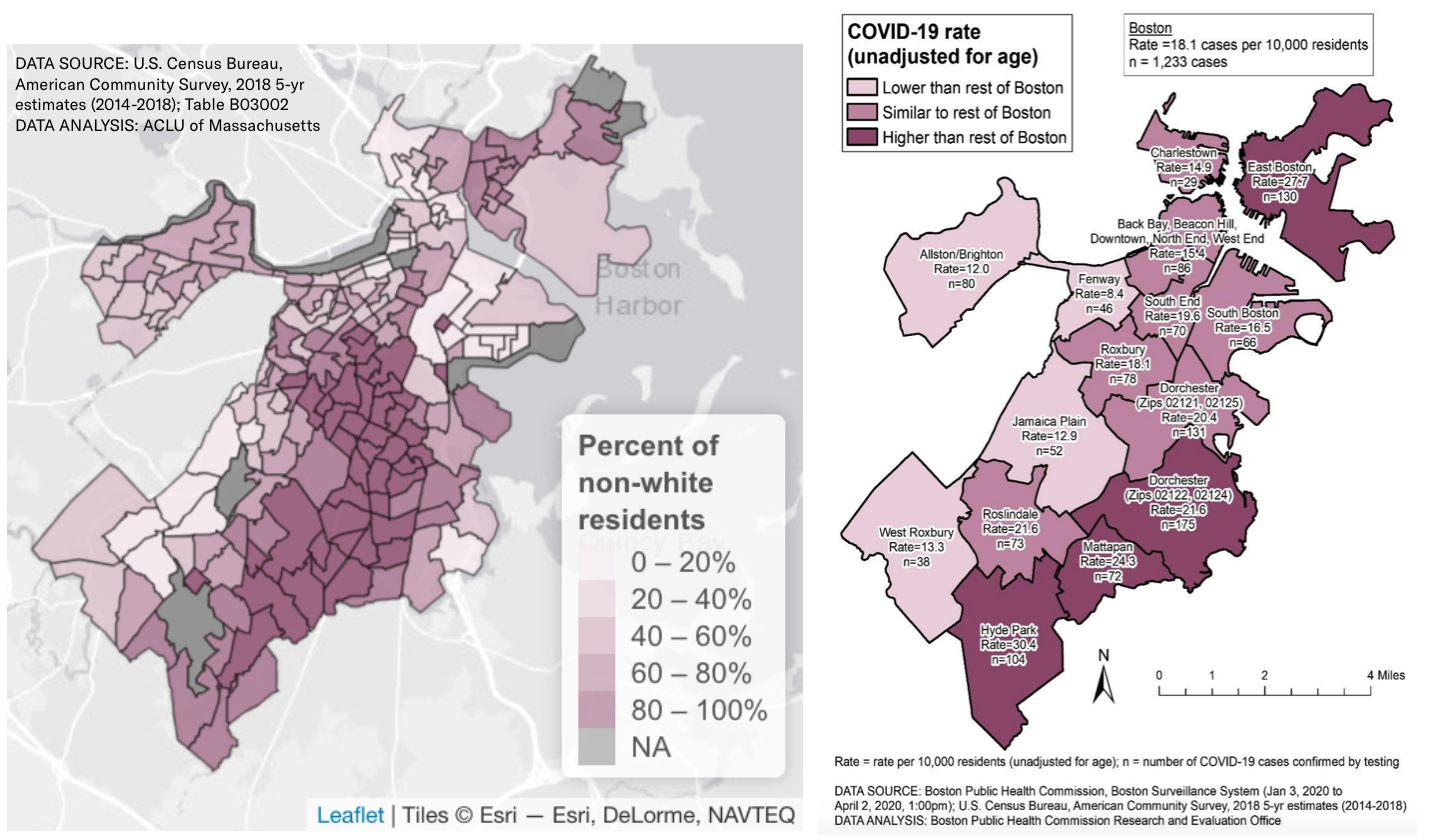
Communities like Hyde Park, Mattapan, and Dorchester where over 50 percent of the population is non-white (including African American, Hispanic or Latinx, Asian, Native American, Multiracial, or any racial category other than "White Alone") are again the same communities with the highest rates of COVID-19.
Latinx-Majority Chelsea Hit Hard
As this crisis evolves, more details are coming into focus that show how already-vulnerable communities are those hardest hit by the virus.
As of April 7th, the city of Chelsea had 315 COVID-19 cases in a population just over 40,000. This translates to a rate of about 79 cases per 10,000 residents – over four times higher than the rate in neighboring Boston of 18 cases per 10,000 residents, as reported by the BPHC.
On Monday evening, Massachusetts General Hospital's Chief Equity and Inclusion Officer, Dr. Joseph Betancourt, reported that 35-40 percent of the COVID-19 patients being treated at Mass. General were Hispanic or Latinx.
https://twitter.com/simonfrios/status/1247253763112517637?s=20
In an interview with WBUR, Betancourt mentioned that the outsized effect Chelsea is experiencing could be due to a number of factors, including increased rates of co-habitation and high proportions of residents working in jobs "where social distancing is not possible."
Indeed, our analysis of 2018 ACS data shows that 79.8 percent of all workers in Chelsea are in COVID-essential positions. In some parts of Chelsea, over 80 percent of the employed population work in occupations that are deemed essential during the on-going crisis:
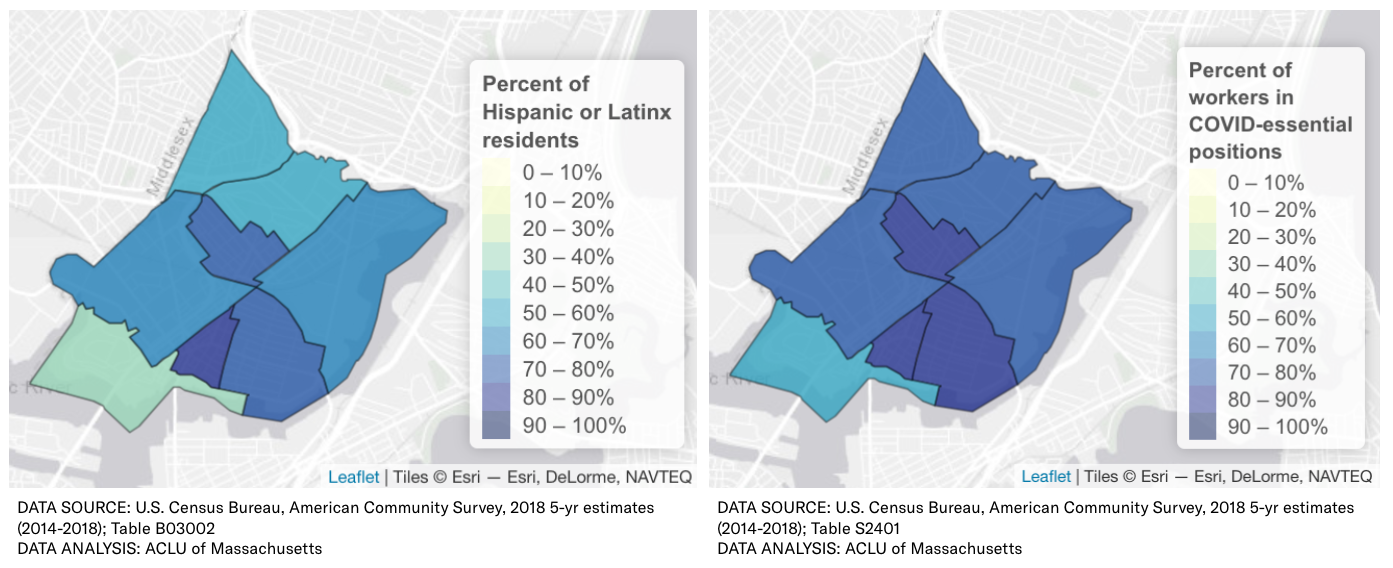
And even within Chelsea, census tracts with the highest proportion of Hispanic or Latinx residents align exactly with the tracts containing the greatest percentage of workers employed in essential jobs.
As editorial writer Marcela García states in her recent Boston Globe piece about Chelsea, “Not only are these immigrants — mostly Latino, many of them here without legal status — the most economically vulnerable, but a high proportion of them already have limited access to health care and other public support networks. Working from home is a privilege that they simply don’t have.” She describes how the COVID-19 outbreak is acting as a “great revealer,” bringing to light systemic inequalities that have plagued minoritized and working-class communities for centuries.
Ultimately, it is communities like Chelsea, with a very high proportion of both COVID-essential workers and residents of color, that are suffering disproportionately in this pandemic. Ironically, a major cause of their increased hardship is the irreplaceable role they play in supporting the continued functioning of all of society, by working essential service jobs.
This is exactly why the ACLU of Massachusetts and other advocacy organizations are pushing for legislative, executive, and judicial action to protect immigrants and working people. While the federal stimulus package passed by Congress in March is a start, it does not go far enough to establish the comprehensive social and economic protections – or the robust data collection practices – required to support vulnerable communities across Massachusetts today.
Our mayors, governors, and representatives must step up. Last week, the ACLU of Massachusetts called on the state Department of Public Health to center equity in its response to the crisis. We must record the race and ethnicity of those receiving tests and treatment for COVID-19, so as to better understand how the virus affects different communities differently. We must ensure that our first responders—including not just EMTs and other healthcare personnel, but also grocery store employees, delivery workers, and public transit operators—have the personal protective equipment (PPE) they need, and have priority access to testing.
The stakes have seldom been higher to get it right on equity. Our leaders must act now in order to save the lives of those working to protect and support us all.
Interested programmers can find the R code used to create these maps on Github.
Edit: A previous version of this blog cited the total percent of essential workers in Chelsea to be 76.9 percent. That number was calculated in error, and has been updated to 79.8 percent.
Welcome to the Data for Justice Project
Government transparency is a hallmark of a free, open, and democratic society. In a democracy, the people rule. But it’s hard to advocate for reforms or policy changes when we don’t know what our government is doing. We can’t manage what we don’t measure.
That’s why the ACLU of Massachusetts is proud to announce the Data for Justice Project. We hope the project will arm activists, advocates, journalists, policy makers, and elected officials with relevant, timely information about how government functions—so we can fix it when it doesn’t.
Why data matters
A few years ago, the Massachusetts state legislature embarked on an ambitious project to reform the criminal legal system. Legislators were moved by personal stories of injustice, and also by data that revealed the systemic nature of these injustices.
Although Massachusetts incarcerates fewer people per capita than most other states, we have a higher incarceration rate than most countries in the world, and among the worst racial disparities anywhere on earth. These depressing data points helped to move the legislature to take bold action to pass omnibus criminal justice reform that, among other things, eliminated mandatory minimum sentencing for certain drug offenses.
Also tucked in to the omnibus criminal justice reform law was an open data measure backed by the ACLU, mandating that the state Executive Office of Public Safety and Security collect arrest data from every police department statewide, and publish it on a regular basis on the state’s website.
That reform is critical, because despite progress, we still don’t know nearly enough about what our government is doing, especially regarding criminal legal system information about arrests, prosecutions, incarceration, and probation and parole.
Even when we can get our hands on data from the criminal legal system, the information is often messy and difficult to work with — sometimes even locked inside PDF files that need to be OCRed or transcribed by hand into a usable format.
Making real the promise of open government in the digital age
The Data for Justice Project is an initiative by the ACLU of Massachusetts that aims to make data actionable, empowering lawyers, advocates, community organizers, journalists, activists, and the general public by:
- liberating government data sets and making them available in digestible formats;
- publishing documents obtained through ACLU of Massachusetts public records and Freedom of Information Act requests;
- advocating for open government at the municipal, county, and state levels;
- developing tools and dashboards to make complex data sets accessible to ordinary people; and
- using data to tell stories to advance the ACLU of Massachusetts’ Freedom Agenda.
The Data for Justice Project is a community resource and public education platform. We encourage data scientists, activists, and others to submit analyses of data sourced from this website, and recommend data sets we should include here. Submission does not guarantee publication. But if your work is compelling, we will work with you to give it a home. For more information, or to get involved, please contact the ACLU of Massachusetts Data for Justice Project at data [at] aclum [dot] org.
Special thanks to Paola Villarreal, who as a Technology Fellow worked with the ACLU of Massachusetts to develop the concept of the Data for Justice Project.