Investigating Boston Police Department SWAT Raids from 2012 to 2020
Today, the ACLU of Massachusetts released a new interactive tool allowing members of the public to visualize and analyze nearly a decade of Boston Police Department SWAT team after-action reports. An ACLU analysis of these reports has identified troubling racial disparities in BPD SWAT raids, particularly when those raids involve drug investigations.
Review Boston Police SWAT After-Action Reports
About the data
This analysis draws on after-action reports of BPD SWAT incidents from 2012 to May 2020. After-action reports are created by the BPD SWAT team to document the unit’s deployments. The reports include descriptions of the incident, information about the people involved (the police, targets, and others impacted), the geographic location of the deployment, and details about the level of police force used during the SWAT action, among other details. The BPD released these reports in response to a 2020 subpoena from then-City Councilor Michelle Wu.
Unfortunately, the documents produced by the BPD were difficult to analyze in bulk; among other problems, they were not machine readable. While the ACLU and our partners made every attempt to ensure the accuracy of the data pulled from these reports, our analysis has some data limitations. For example, the underlying after-action reports occasionally include missing, clearly incorrect, or difficult-to-interpret data. As explained in greater detail in the methodology section at the bottom, some errors may also have arisen in our processing of the records and extraction of information. That said, we engaged in a human review of the documents to ensure any errors in our extraction do not impact the overall analysis of trends.
The data: Disproportionate SWAT policing of Black and Brown communities and people
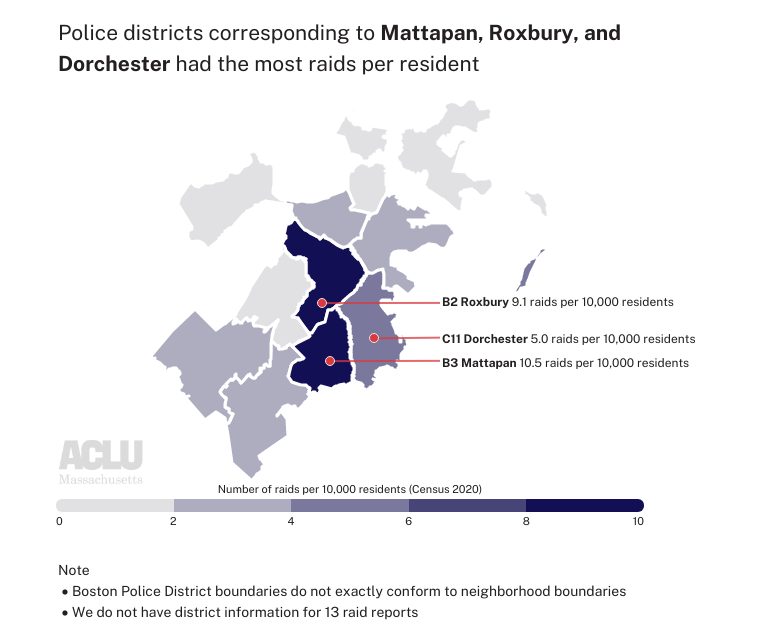
There are 262 after-action incident reports representing deployments between 2012 and May 2020. A significant portion of these police actions took place in police precincts roughly corresponding to the neighborhoods of Mattapan, Roxbury, and Dorchester.
According to data reported by the Boston Planning & Development Agency Research Division, these three neighborhoods had the highest percentage of residents who are non-white (i.e., identifying as a race other than white or as white along with one more other races) of any Boston neighborhood in 2020. These neighborhoods also had a relatively higher share of residents identifying as Black or African American and/or Hispanic than most other Boston neighborhoods.
After-action reports typically list one or more “incident types” indicating the reason(s) for the raid. In order of frequency, the most common types were Search Warrant – Other/Unknown, Search Warrant – Drugs, Mental Health Crisis, and Barricaded Suspect.
Like other SWAT teams, the BPD SWAT unit is deployed in response to active crises and in deliberate, planned SWAT raids. Typically, the latter cases involve the serving of search and arrest warrants. While the BPD has discretion about whether to deploy the SWAT unit in response to calls for service, SWAT deployments pertaining to active emergencies like mental health crises, barricaded suspects, and domestic violence incidents are nonetheless responsive to active emergencies in the community. On the other hand, the deployment of the SWAT unit to serve warrants, particularly search warrants, is more reflective of self-directed police work. For that reason, racial disparities in the use of SWAT units to serve search warrants are a significant cause for concern.
Data indicate that white and Black people in the United States use and sell drugs at approximately the same rates. But the BPD’s SWAT unit serves drug warrants almost exclusively on people of color.
The data: Targets of the BPD's SWAT raids
According to the after-action reports, 784 people were subjected to SWAT raids between 2012 and 2020. 270 of these individuals were specifically marked as the “suspects” or “targets” of the raid.
The ages of all raid subjects ranged widely from infants to 83-year-olds. Individuals between 20 and 40 years old were the largest group impacted. For those marked specifically as raid suspects or targets there is a smaller range of ages; the youngest person was 16 and the oldest was 67.
According to the reports, 105 children under the age of 18, including 25 children under the age of 5, lived in homes subjected to BPD SWAT raids between 2012 and early-2020.
Those impacted by raids were predominantly men, accounting for 88% of those targeted by raids and 62% of all individuals subjected to raids. When considering both race and gender, Black men were the largest group of those both subjected to raids (38%) and marked as raid suspects/targets (50%).
There are significant racial disparities in those targeted and all those impacted by raids — 56.3% of those targeted by raids were Black non-Hispanic and 8.5% were Black Hispanic. These figures are disproportionate to the share of Black residents in Boston. As of the 2020 Census, 25.5% of Boston’s population was Black or African American; this figure includes multiracial residents and both Hispanic and non-Hispanic residents. Of this, 22% of Boston’s population was Black non-Hispanic, and 3.4% was Black Hispanic. Hispanic residents are also disproportionately impacted by raids. 28.7% of those targeted by raids were recorded as Hispanic, White Hispanic, or Black Hispanic; however, the 2020 Census found that Hispanic or Latino residents made just 19% of Boston’s population.
The disproportionate share of Black and Hispanic individuals impacted by raids varies by incident type; the disparity is notable in “officer-initiated” raids* such as those for search warrants. In contrast, the demographics of people subjected to SWAT team involvement in crisis-related incidents, such as mental health crises, more closely reflect the demographics of Boston.
*To better understand BPD SWAT unit practices, we categorized incident types into “officer-initiated” incidents such as search warrants or arrest warrants and “crisis-related” incident types that reflect an emergency such as a mental health crisis.
Another way to view this disparity is to look at the share of white non-Hispanic residents impacted by raids. White non-Hispanic people are underrepresented in officer-initiated raids; Boston’s population is 44.6% white non-Hispanic, but the group of people impacted by all officer-initiated raids are only 6.5% white. In contrast, white people were involved in crisis-related raids at a rate more proportionate to the overall population; 33.5% of those impacted by these raids are white.
The data: SWAT team after-action reports document frightening, militarized surprise raids
Reports detail the SWAT team battering down doors, deploying aerosol grenades, waking individuals asleep in bed, and detaining relatives of suspects and children. According to the reports, well over half of the people subjected to this level of force were not even the targets of the operation but were just roommates, partners, family members, or children who were present in the home during the raid.
SWAT raids can even harm people who live nearby a person wanted by police. One of the records details a raid where the entire household was not the target of the operation; the SWAT team failed to go to the correct address on a search warrant and wrongfully invaded another family’s home. In 2018, the ACLU of Massachusetts represented this family in a lawsuit against the BPD. As our lawsuit on behalf of the family alleged, “[the BPD SWAT team] used a battering ram to break down the door, trained guns on and handcuffed the parents ... and their 15-year-old child, and ransacked the home with two younger children present.” The family suffered lasting emotional distress from this assault. Ultimately, the case was settled and the City was forced to pay the family $500,000.
If you are interested in learning more about the practices of the BPD SWAT team, please use the interactive BPD SWAT records review tool. In addition to exploring the data, you can also read the original after-action reports, which include a narrative description of the incident at the end of each document. Please don’t hesitate to contact data4justice@aclum.org with any significant findings.
Review Boston Police SWAT After-Action Reports
Data Notes and Methodology
The original incident reports were made public as non-machine-readable PDFs. Therefore, the first task of this project involved determining how to extract information from these files in a usable format. Volunteer data scientists began by OCR-ing and processing the PDF files to extract useful fields from the documents. Due to the nature of the PDFs and occasional image quality issues, the programmatic data processing and extraction of these reports was subject to error. As a final measure to address any errors and ensure overall data quality, selected fields were manually reviewed and updated by volunteers. For additional data documentation please see the “data notes” section of the BPD SWAT tool.
This data extraction project was possible with the support of:
- Tarak Shah, Human Rights Data Analysis Group — programmatically extracted data from the after-action report PDFs
- Aaron Boxer, ACLU-MA volunteer — conducted data extraction, processing, manual entry, and analysis
- Natasha Ceol, ACLU-MA volunteer — assisted with data quality-checking and redaction of the after-action reports.
Analyzing Mayor Wu’s FY24 Boston Police Department Budget Recommendation
See our previous work on policing in Massachusetts
On April 12, Mayor Wu submitted her recommended operating budget for the upcoming fiscal year (FY24) to the Boston City Council, kicking off the public portion of the City’s budgeting process. Among other investments, the Mayor’s budget proposes funding the police department at $9.88 million over its FY23 budget.
Over the coming months, the City Council will review the Mayor’s budget recommendation and can propose and vote on changes. During this same review period last year for the FY23 budget, the City Council unanimously proposed reducing funding for the police department and increasing funding for youth engagement and employment programming, among other proposed changes. These efforts had a limited impact in 2023, however. The Mayor’s budget passed with a few small tweaks from the Council.
This analysis focuses on the Boston Police Department’s (BPD) budget. Our hope is that this breakdown will be useful for community members, journalists, and other interested parties as the City’s various stakeholders and residents engage in conversations and debate on the budget, which are set to take place between now and July. To explore the full recommended operating budget and design your own changes, please see our (Co)Design the Boston Budget calculator tool.
The Mayor’s proposal would increase the Police Department budget by $9.88 million
Of the $4.28 billion city operating budget, the Mayor’s recommended budget allocates $404.97 million to the Boston Police Department.
The recommendation is an increase of $9.88 million from last year’s BPD adopted budget of $395.09 million. (Note: the City’s recommended budget document describes this as a smaller $9 million increase for the BPD budget, comparing the Mayor’s FY24 recommendation to the FY23 appropriation of $395.91 million rather than the FY23 adopted budget of $395.09 million. This analysis compares the FY24 recommended budget to the adopted budget of previous years, not the appropriated budgets.)
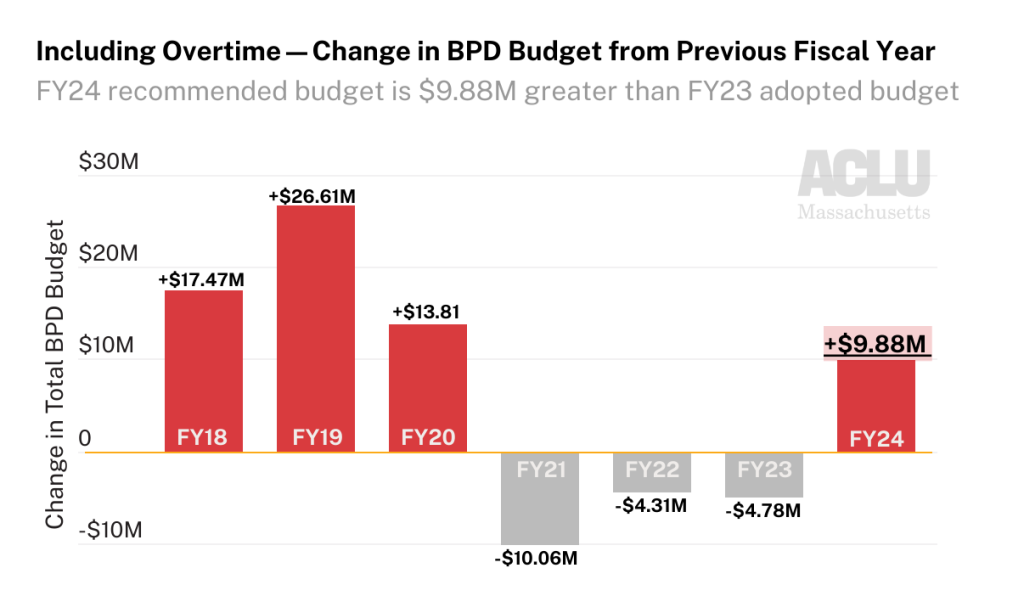
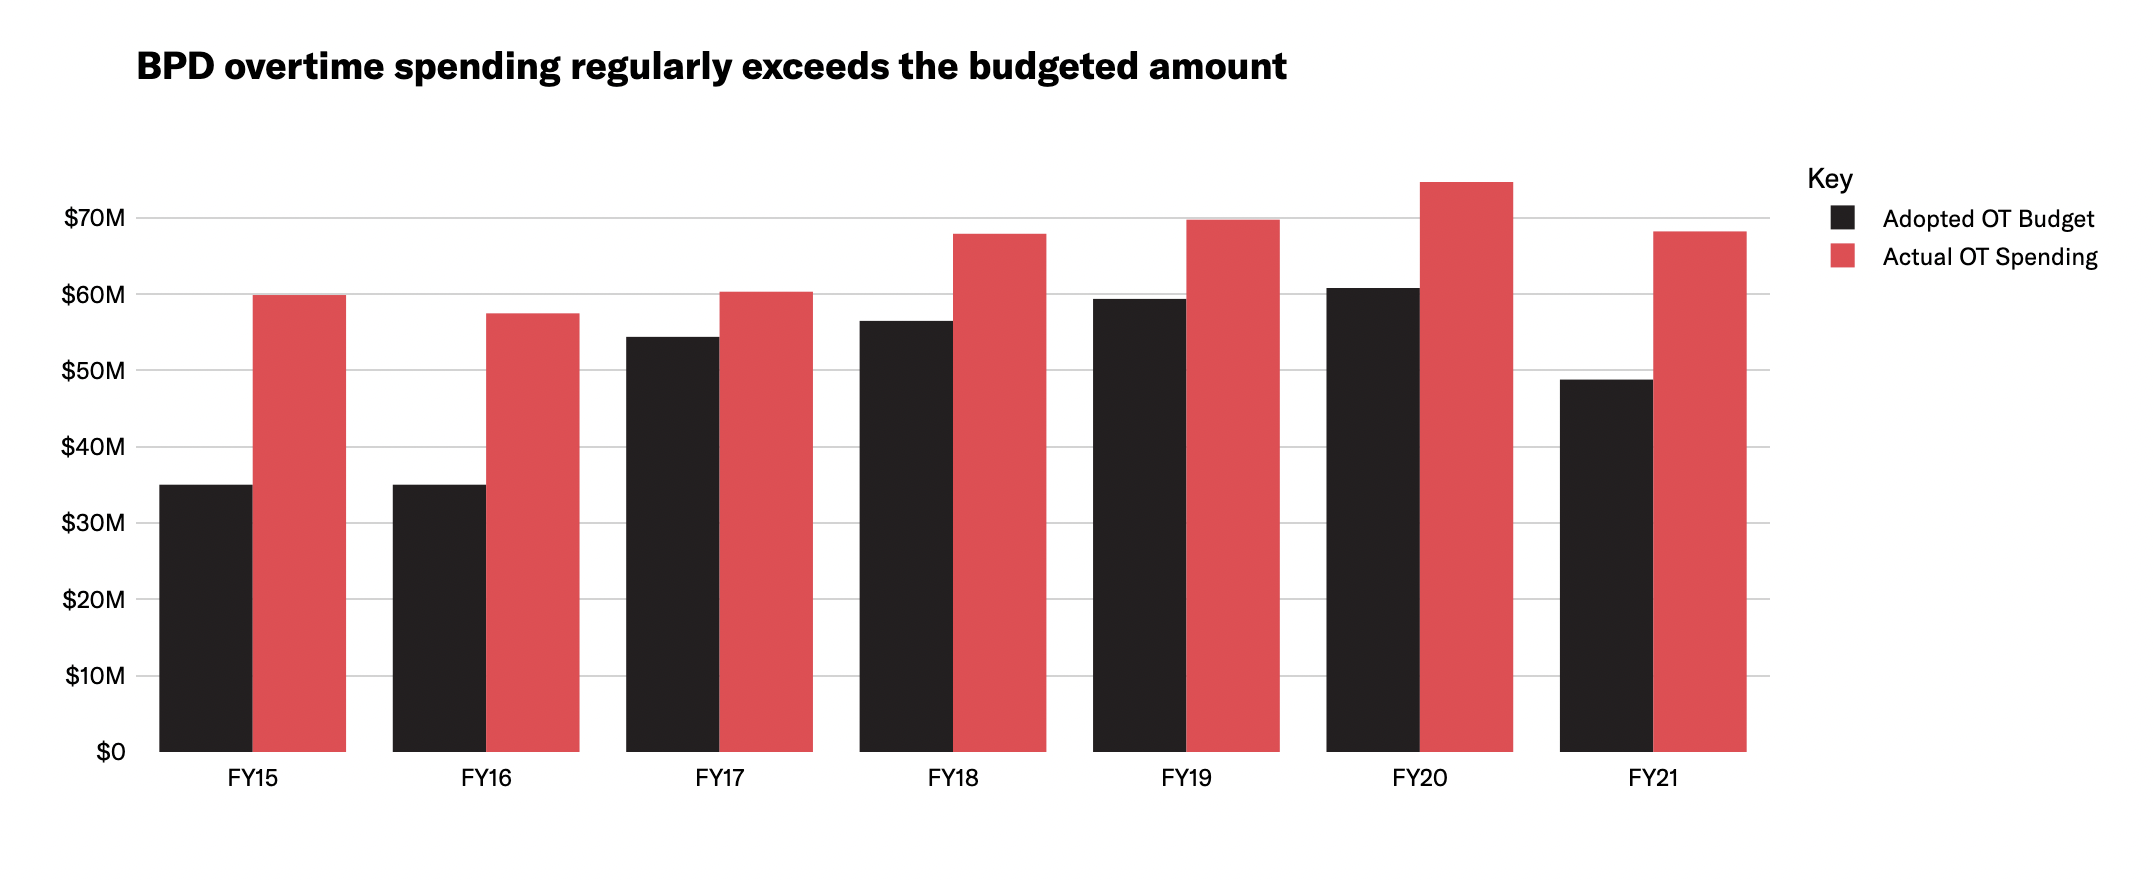
In adopted BPD budgets of recent years, there have been significant reductions to the police overtime line item; notably, this FY24 recommended budget does not make additional changes to police overtime. The FY21 and FY22 budgets both significantly reduced the overtime line item from previous fiscal years, and both the FY23 adopted budget and FY24 recommendation preserve those cuts. However, police overtime spending is not constrained by a reduction in the line-item overtime allocation; all police overtime is paid by the city even when it exceeds its appropriation. Since actual overtime spending frequently surpasses its budget line item, the analysis below compares the Mayor’s FY24 BPD budget recommendation both in its entirety and with the overtime line item excluded.
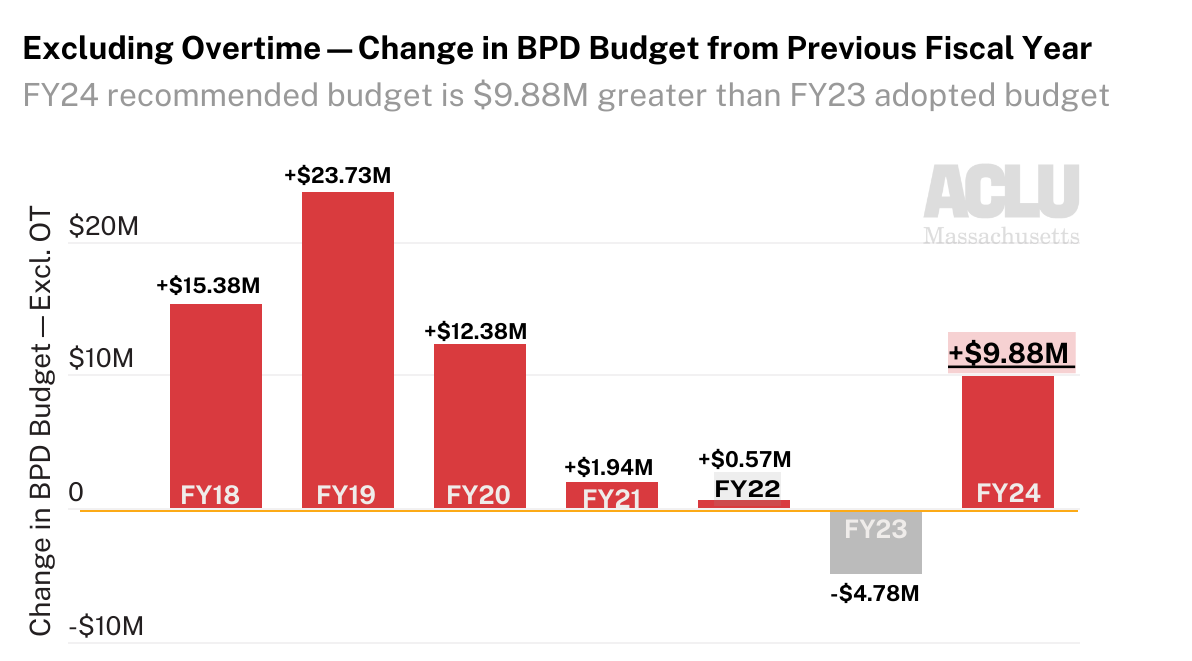
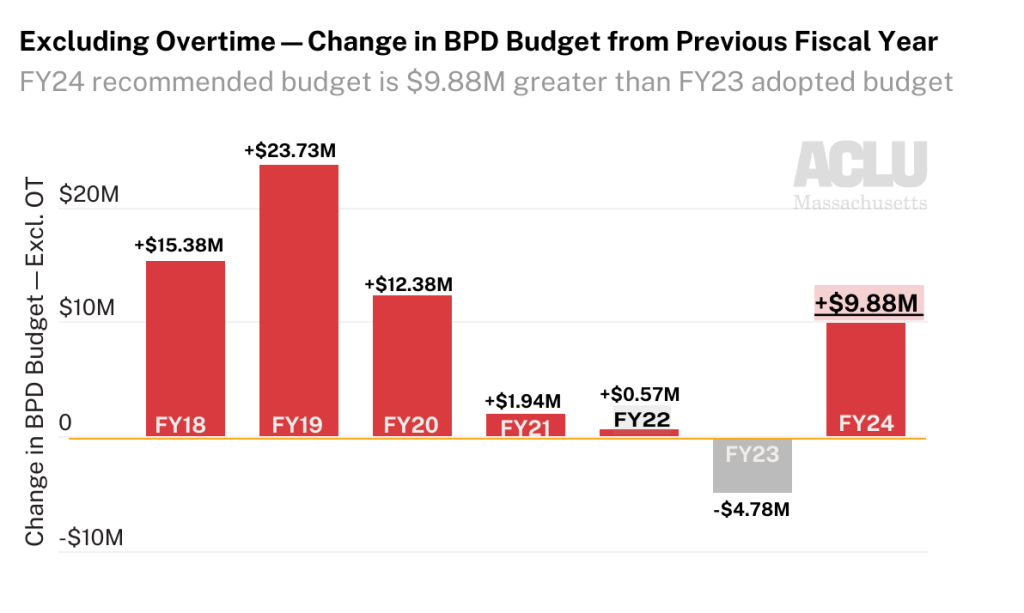
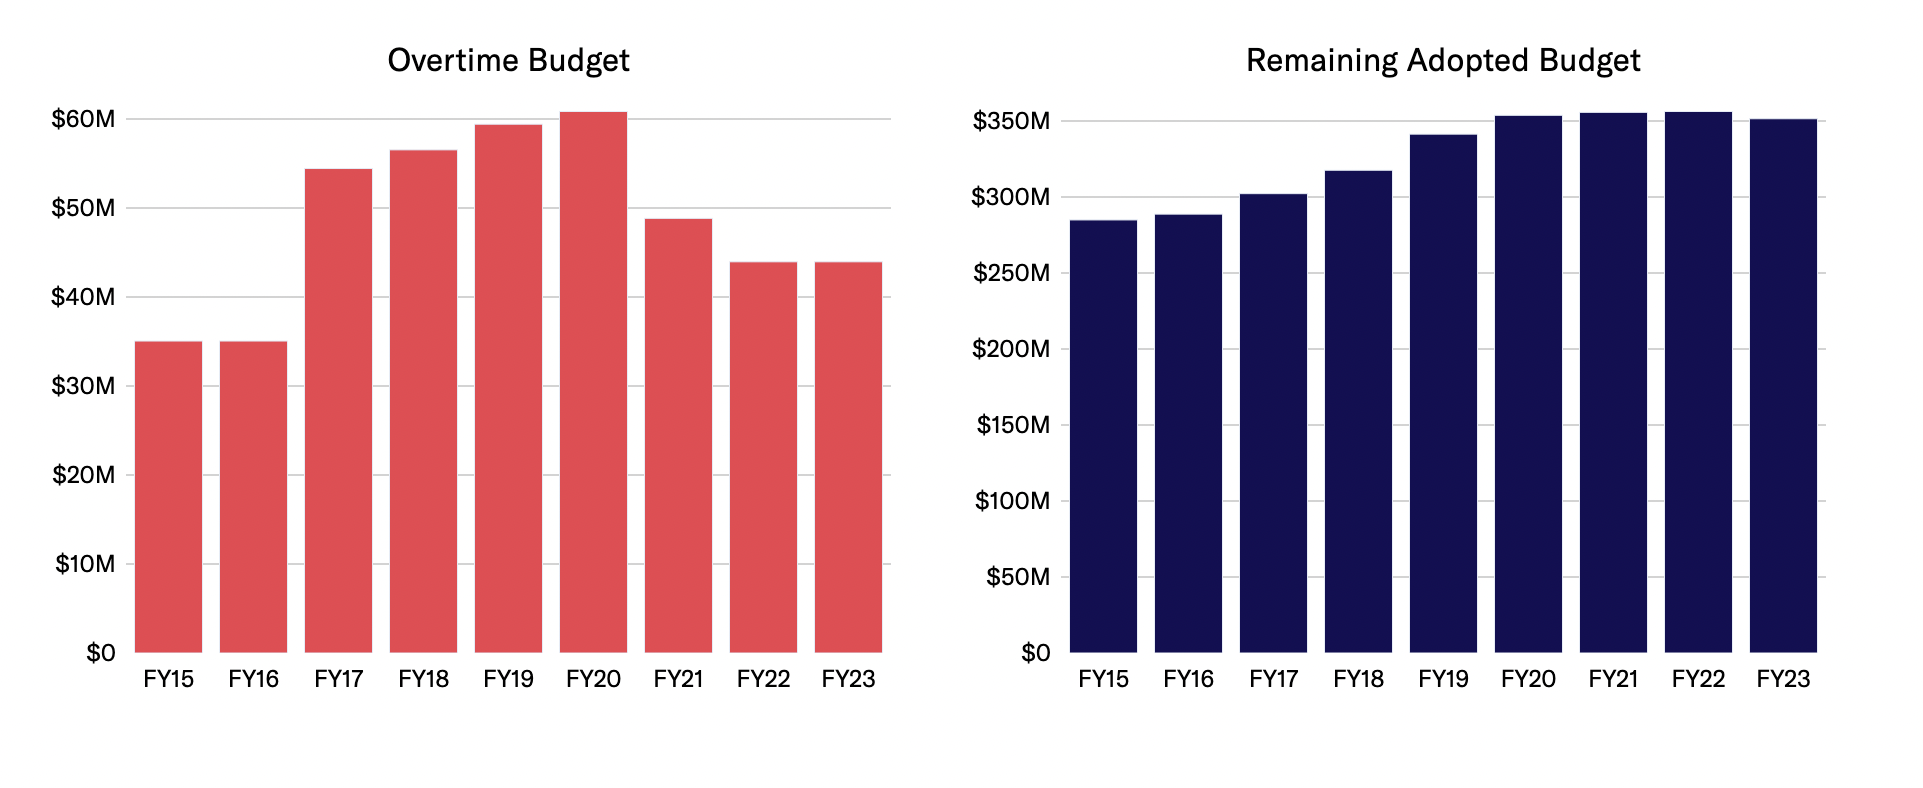
When excluding the overtime budget, the remaining portion of the Mayor’s recommended FY24 BPD budget is the largest in recent years.
The proposed increase in the FY24 police budget represents a shift. In the past few years since 2020, the growth of BPD’s adopted budget has curbed in response to community calls to shift funds from policing into community health and safety initiatives. When excluding the overtime line item, the $12.38 million increase between FY19-FY20 was followed by much lower increases of $1.94 million between FY20-FY21 and $0.57 million between FY21-FY22. Last year’s FY23 adopted budget, also proposed by Mayor Wu, showed a reduction of $4.78 million from the FY22 budget—the first such reduction to non-overtime sections of the budget since at least FY15. An increase of $9.88 million for FY24 would break from the trend of the past few years.
Where is this additional money going?
The bulk of the Mayor’s proposed budget increase for BPD provides funding for police department staff. According to the City’s budget documents, the FY24 recommended budget would fund “a recruit class to replace project attrition” and $582,000 to the Youth Connect program, which provides social workers for police precincts. Last year’s FY23 budget also increased the size of the police cadet class from 60 to 90; it appears that this budget preserves that increase.
Here’s how the BPD’s staffing levels under the FY24 recommendation would compare to other city departments, excluding the Boston Public Schools.
The Mayor’s budget recommendation proposes 2,766 full-time equivalent employees (FTE) at BPD on 1/1/24. This represents:
-
- 3.3x the FTEs of the Public Health Commission
- 7x the FTEs of the Public Library
- 10.3x the FTEs of the Boston Center for Youth & Families
- 11.8x the FTEs of Parks and Recreation
This is an increase of 108.6 full-time equivalent employees compared to 1/1/23, though as city documents note, it is important to bear in mind that the number of employees on January 1 of a given year often varies due to retirement timing and the start of new classes. Budget documents describe this change in staff levels along these lines—as a reflection of last year’s police class being delayed until April 2023.
The size of BPD’s full-time equivalent staff exceeds not just departments but entire city cabinets. The police department is larger than every cabinet besides Education and its own Public Safety cabinet.
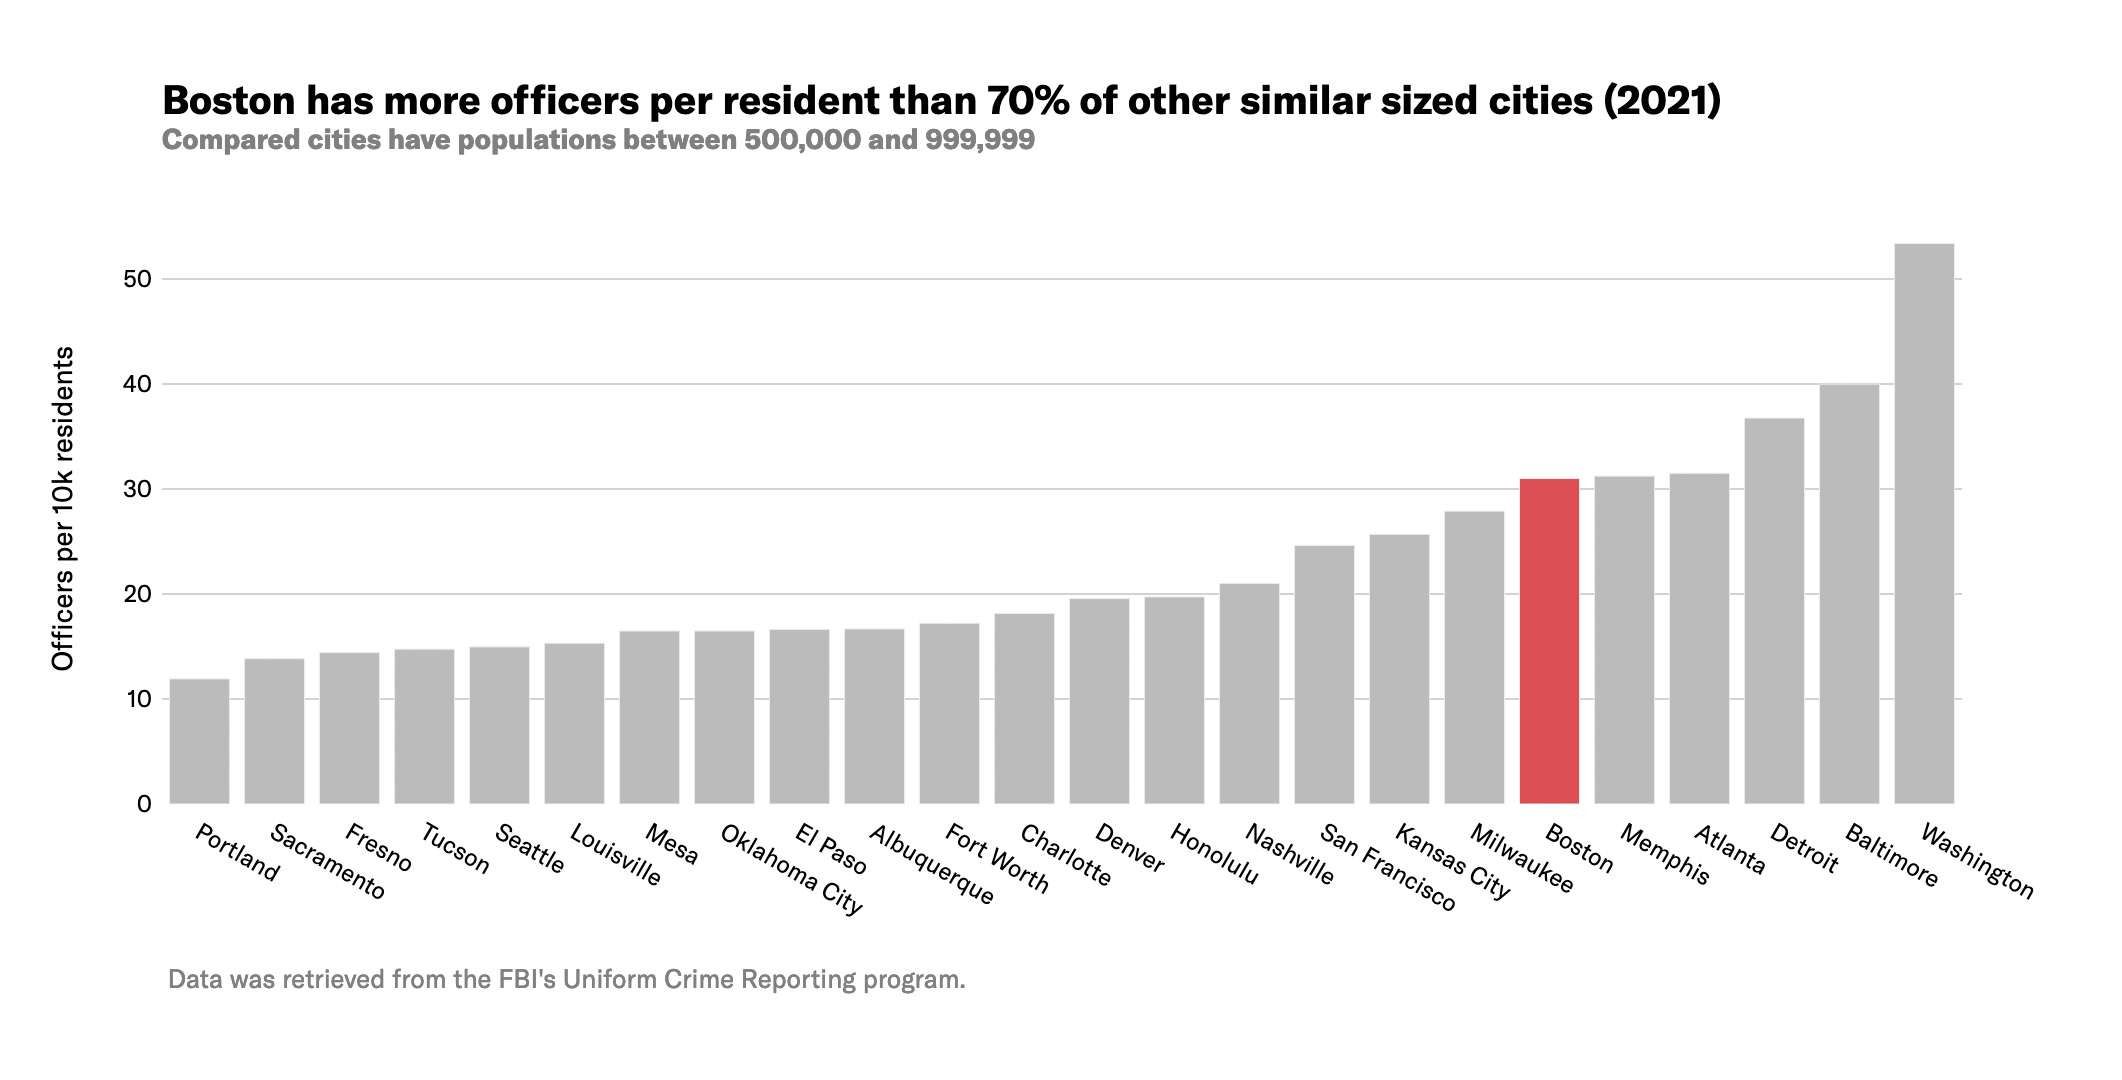
Boston has typically had higher-than-average police staffing. As we previously demonstrated using FBI UCR data, in 2021 Boston had more officers per resident than 70 percent of similarly sized cities.
BPD has a higher budget than every city department other than Boston Public Schools
Year after year, the Boston Police Department has the second-largest budget of any department, second only to the Boston Public Schools.
Note: The chart above excludes Boston Public Schools, which has a FY24 recommended budget of $1.45 billion.
Just as the size of the police department staff surpasses nearly all other departments and cabinets, so does the size of its budget. Per the Mayor’s recommended FY24 budget, the BPD budget would be:
-
- 3.2x the size of the Public Health Commission
- 8.5x the size of the Library Department
- 9.9x the size the Environment, Energy, & Open Space Cabinet
- 13.5x the size of the Boston Center for Youth & Families
- 22.5x the size of Youth Employment and Opportunity
Boston Police Department overtime spending
The police department’s funds extend beyond the already-sizable adopted budget; the City pays all overtime costs that the police department incurs even when they exceed the initial budgeted amount. And as we’ve documented the police also receive large amounts of grant funding from the state and federal governments each year.
The department continually exceeds its overtime appropriation. Last year’s overage was particularly substantial, since the FY22 police overtime budget was reduced on paper but actual police expenditures did not decline accordingly. The department spent $72.33M on overtime: similar to previous years’ overtime spending but $28.41M more than budgeted.
To put this overage in perspective, the difference between BPD’s budgeted overtime allocation and its actual overtime spending in one year could fund not just departments but entire City cabinets. $28.41M is enough to cover the FY22 expenditures for the Cabinets of Equity and Inclusion ($9.8M), Economic Opportunity and Inclusion ($7.6M), Community Engagement ($4.22M), Arts and Culture ($3.50M), and Office of Police Transparency and Accountability ($718K) combined, with a couple million to spare. This FY22 overage is also over half of the Boston Public Library’s budget.
For more on BPD payroll and overtime during the 2022 calendar year, please see our previous analysis.
Data Sources
- Boston’s open data portal
- Boston’s City budget website
-
- Current and past fiscal year budgets at bottom of page; information was obtained from the “operating budget” and “public safety cabinet” sections of the budget documents
Explore the FY24 budget recommendation
- FY24 recommended budget document (at bottom of page) and dataset
- (Co)Design the Boston Budget—budget calculator tool helping you design your own operating budget, using the FY24 recommendation as a starting point
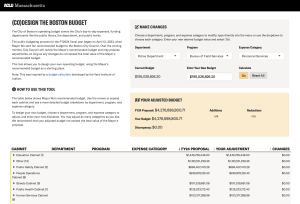
(Co)Design the Boston Budget – Budget Calculator
How to get involved
- Members of the public may testify at City Council hearings on the budget, which started this week and will continue through early June. Public testimony, including virtual public testimony, will be accepted at each hearing and at the public testimony hearings.
-
- Resources
-
-
- City Council Budget website – full hearing schedule towards bottom of page
- Public Notice – updated dates and times of hearings
- Boston City Council TV – hearing livestreams
- Guidance on testifying at a budget hearing
-
-
- Schedule for BPD budget hearings, public testimony, and working sessions as of 5/5/23. These are subject to change—confirm hearing dates and times through Public Notice. Both the Ianella Chamber and Piemonte Room are on the Fifth Floor of Boston City Hall:
-
-
- Thursday, May 11 at 10am (Iannella Chamber) – Hearing: BPD Revolving Funds
-
-
-
- Thursday, May 11 at 2pm (Iannella Chamber) – Hearing: Grants, Reform, Community Programs, and Crisis Response
-
-
-
- Thursday, May 17 at 6pm (Iannella Chamber) – Public Testimony: BPD, BFD, Safety, BEMS
-
-
-
- Tuesday, May 30 at 2pm (Piemonte Room) – Amendments Working Session: BFD, BPD
-
The analysis benefitted from feedback and input from Fatema Ahmad (MJL), Lauren Chambers (UC Berkeley I School; ACLUM), and Youth Justice and Power Union. Data analysis was informed by work done in collaboration with Boston University students under the supervision of the BU Spark! Program.
Looking Back at the FY2023 Boston Police Department Budget
See our previous work on policing in Massachusetts
Mass nationwide mobilization in 2020 against policing violence and the anti-Black criminal legal system intensified calls for government action against police abuse. Among many other things, this organizing brought heightened public attention to municipal police budgets. In Boston, groups including Muslim Justice League, Families for Justice as Healing, Youth Justice and Power Union, Asian American Resource Workshop, Boston Cyclists Union, The City School, and Boston Liberation Health have in recent years called on the City Council and Mayor to shift funds from the Boston Police Department into community safety and wellness programs.
The City of Boston is soon approaching budget season for the upcoming fiscal year; the Mayor’s proposed FY2024 budget is expected to be filed by April 12. To help inform the forthcoming conversations around the proposed budget for next year, Boston University’s Spark! Lab and the ACLU of Massachusetts analyzed the FY2023 (2022-2023) budget for the Boston Police Department.
This analysis shows that the adopted FY2023 police budget, which is 1.19% smaller than in FY2022, is similar to previous years.
The FY2023 Boston Police Department budget is slightly smaller than previous years
The total FY2023 City of Boston operating budget is $3.99 billion. Of this, the Boston Police Department (BPD) is budgeted $395 million.
The FY2023 BPD budget is 1.19% smaller than the department’s near-$400 million FY2022 budget.
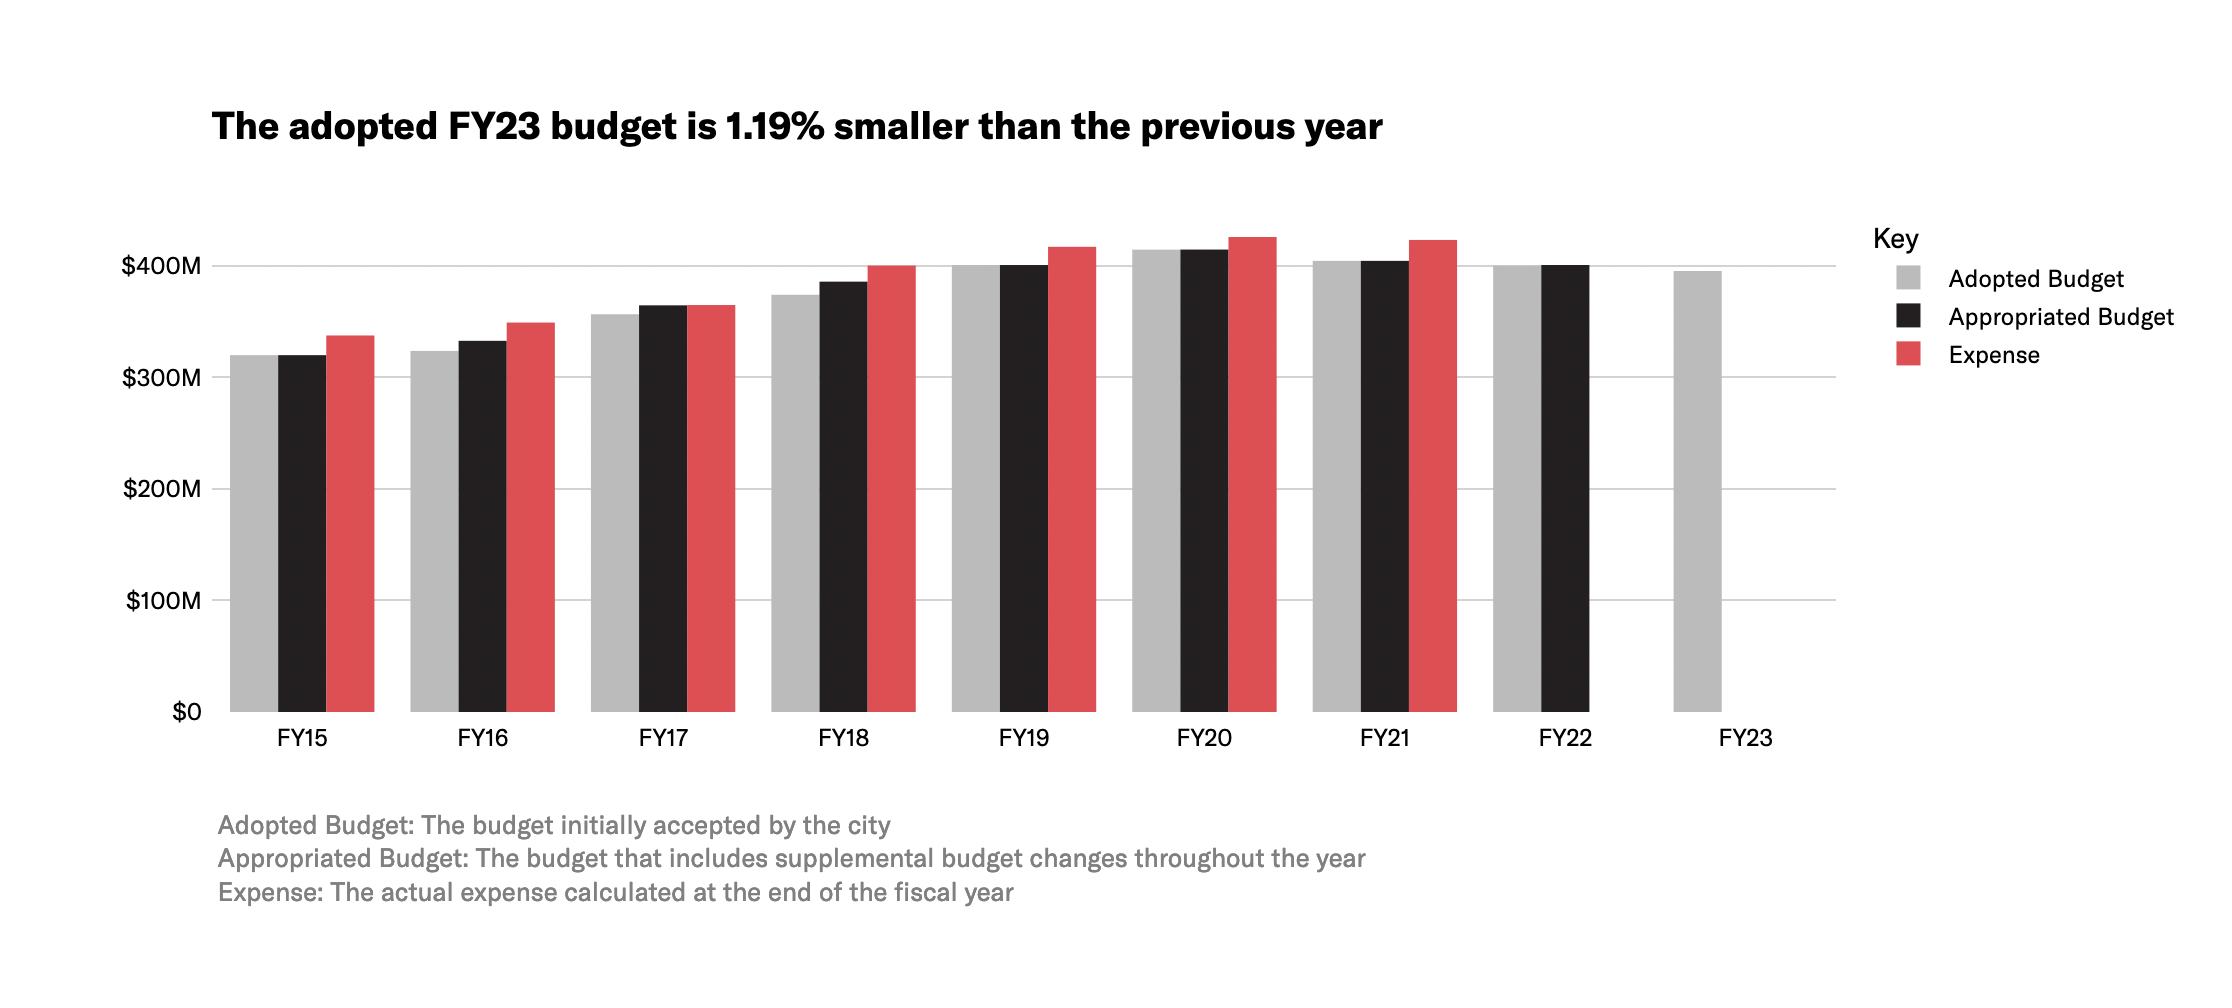
According to the City, these budget reductions primarily result from a lower budget for salaries because younger officers are replacing older officers. In addition, the Mayor postponed an academy class by one month, saving the city $1 million.
However, the number of police officers in the budget increased in the FY2023 budget, as did the number of 18-25 year olds in a cadet program designed to train people who will apply to become police officers in the future. In addition, contract negotiations are underway with the police associations. If the city agrees to retroactive pay increases, then the existing contracts would retroactively increase the FY2021, FY2022, and FY2023 budgets and potentially reverse reductions in those budgets.
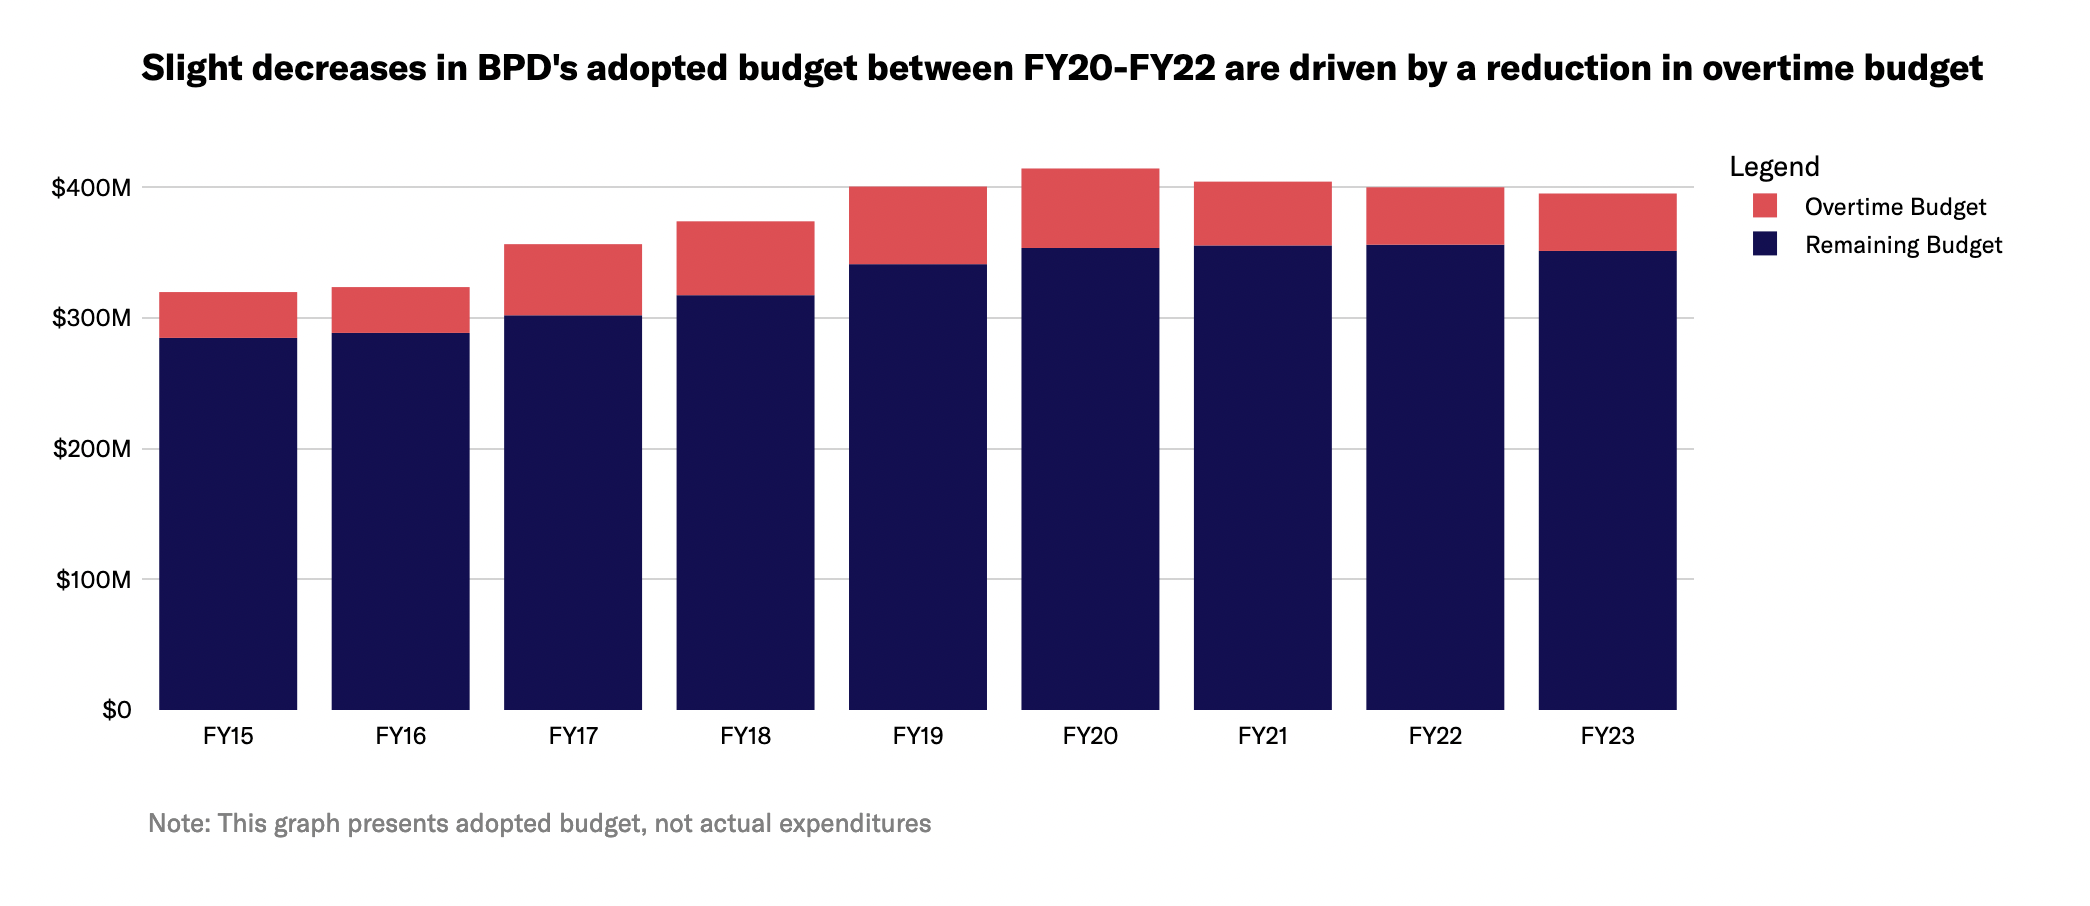
Unlike the past few years, the FY2023 BPD budget reduction was not due to a reduction in the overtime line item
Looking back at previous years, the slight reduction in the adopted Police Department budget between FY2020 and FY2022 can be attributed to reductions in budgeted police overtime. Reductions in the overtime budget outweighed increases in other areas and contributed to a small overall decline in the total size of the department budget.
However, these reductions in the overtime budget have a limited impact on decreasing police spending, because the City is required to pay whatever overtime is incurred regardless of what is budgeted. In fact, actual overtime expenditures regularly exceed the budgeted amount, including in FY2020, FY2021, and FY2022. While the overtime budget decreased from FY2020-FY2021 and FY2021-FY2022 by $12 million and $4.88 million, respectively, actual overtime spending decreased by $6.48 million and (based on City estimates in May 2022) $1.4 million, respectively. Real overtime cuts will require both contract reforms as well as overhauling BPD’s practices around overtime.
This FY2023 budget reduction is notable in that the $4.78 million decrease in the BPD budget is not due to a decrease in the overtime line item.
When disregarding the overtime line item, the remaining BPD budget has been stable in recent years. It increased slightly from FY2020 to FY2022 and decreased slightly in FY2023. FY2023 is the first year since at least FY2015 that the non-overtime sections of the BPD budget decreased.
The Boston Police Department budget is the second-largest line item in the entire budget, second only to Boston Public Schools
The Boston Police Department’s $395 million budget makes up nearly 10% of the entire City of Boston operating budget. In comparison with other City departments, it is:
- 13.84 times the size of the Parks Department
- 9.13 times the size of the Library Department
- 3.35 times the size of the Public Health Commission
- 1.43 times the size of the Fire Department
The City pays more for policing than what is reflected in the operating budget
Yet the amount allocated to the police in the operating budget is not the full picture of BPD’s funds. City employee benefits, overtime, and external funding all contribute to department resources:
- As detailed by Citizens for Juvenile Justice’s Hidden Costs of Policing report, the City pays separately towards pension and health insurance for police department staff. Although these costs fall outside the operating budget and are not reflected in this analysis, they are a significant part of the full cost of operating the Boston Police Department. The Hidden Costs of Policing report shows that this expense was over $168 million in FY2021.
- With police overtime overages, the City regularly pays more to BPD than the adopted budget amount. In FY2021, over $68.2 million of overtime was incurred, which was $19.4 million more than what was budgeted. Due to the City’s interpretation of an exception in the Boston charter, the amount spent on police overtime—even if it exceeds the budget—is always paid out. For more on this exception, please see our April 2021 analysis.
- The Boston Police Department also gets funding from external sources. As noted in a previous D4J analysis, BPD gets additional money through the separate Office of Emergency Management and other state and federal grants.
Thus, the full operational costs of the Boston Police Department are even greater than the already-extensive operating budget (and greater than what is reflected in this analysis here).
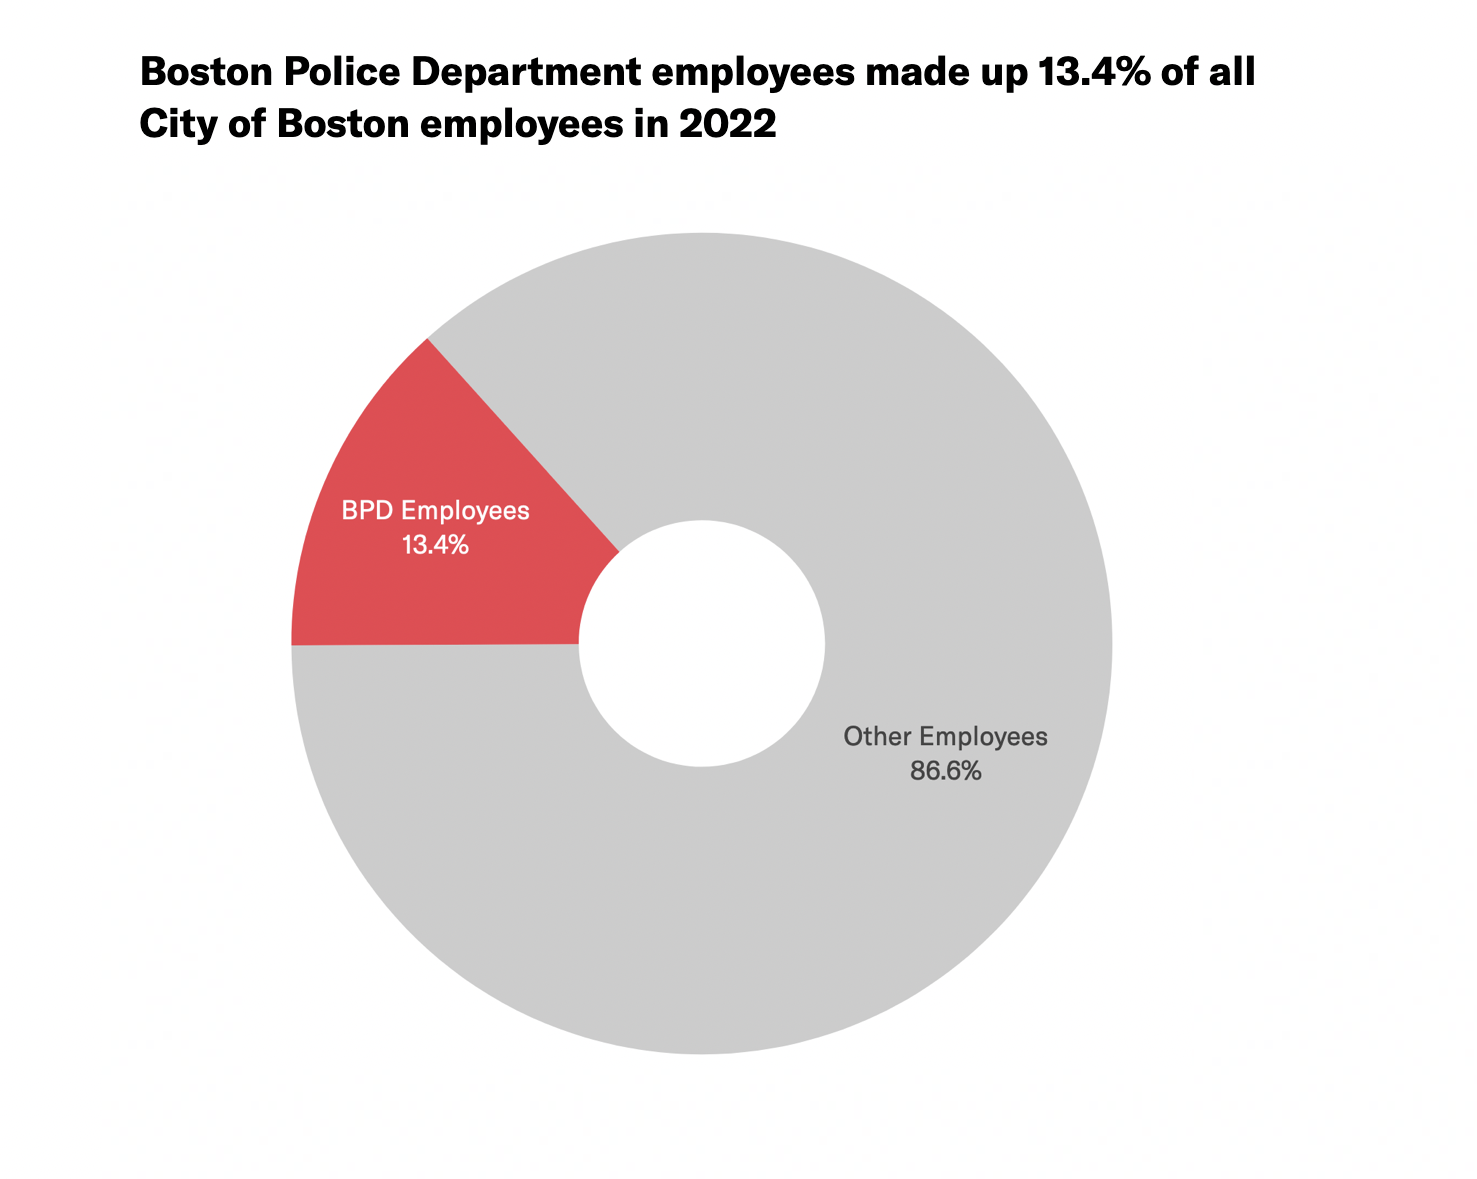
In 2022, 1 in 5 of the City’s payroll dollars went to BPD
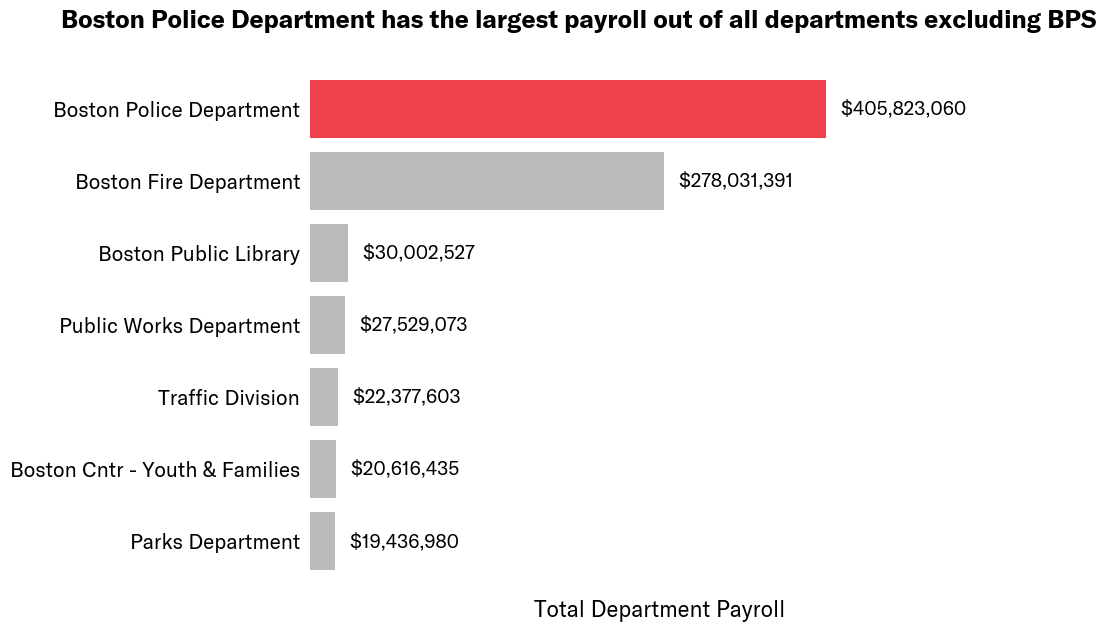
The Boston Police Department’s payroll totaled $405 million in the 2022 calendar year, according to the City’s employee earnings report.
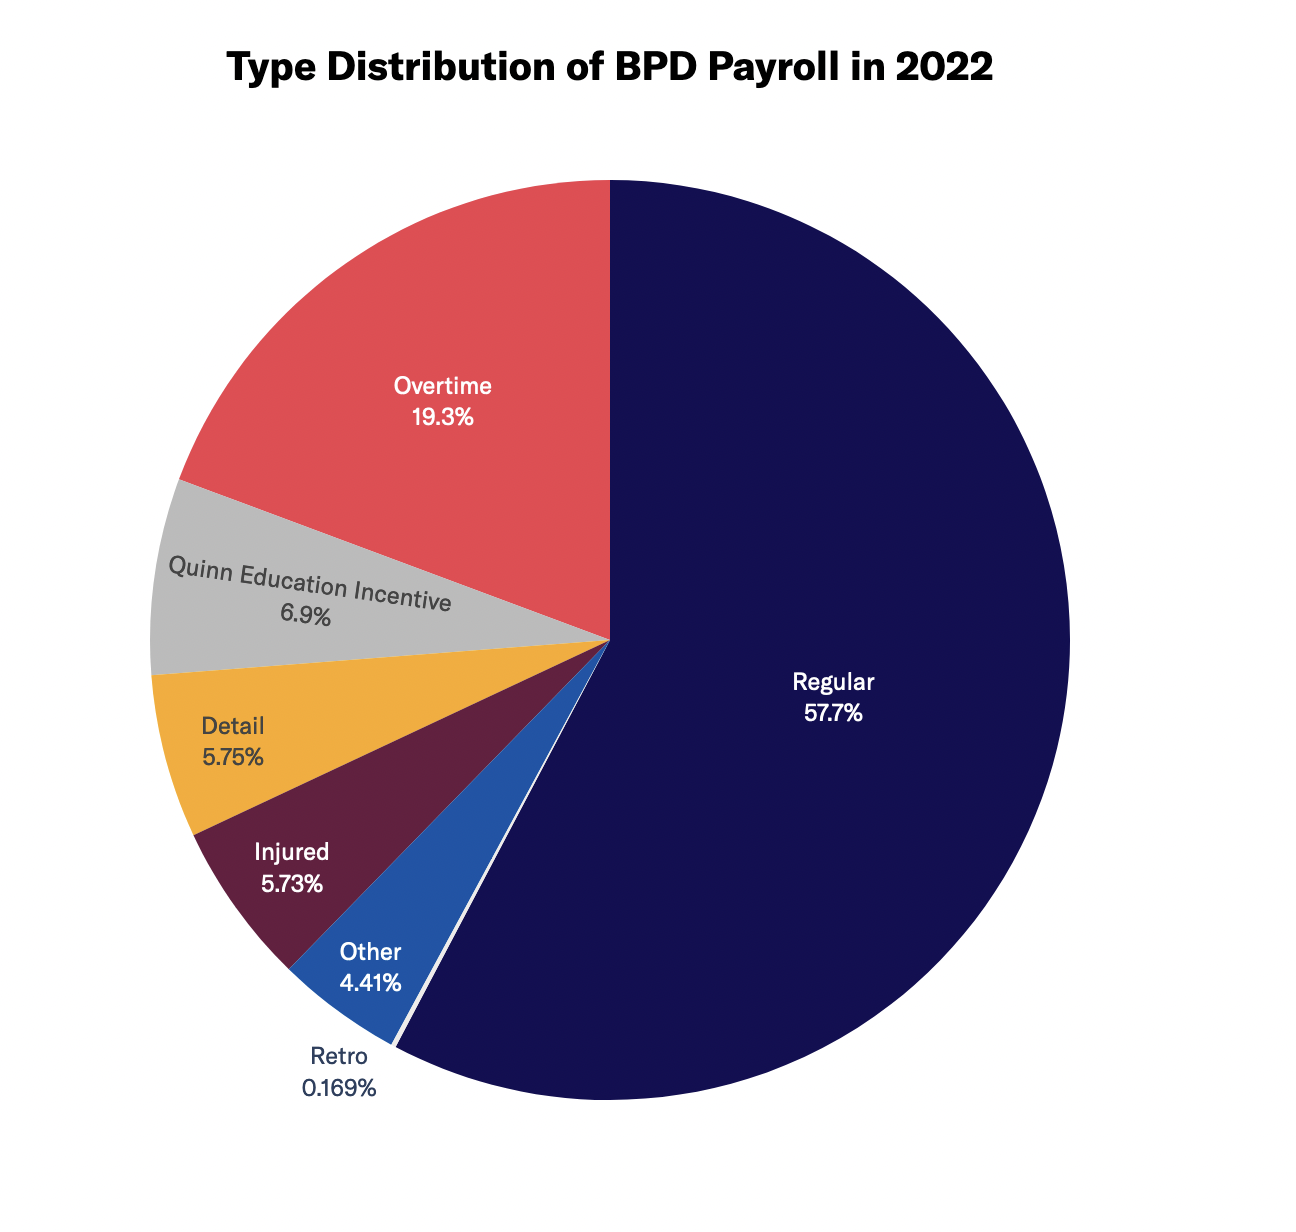
This figure includes more than just base salary and overtime. The earnings report shows payroll earnings from all the following categories: paid detail, injured, overtime, education incentive, regular, retro, and other (including from bonus incentives, grievance/settlements, stipends, and reimbursements).
To put this $405 million figure in perspective, the size of the Police Department payroll was:
- 20.88 times the size of Parks Department
- 13.53 times the size of the Public Library
- 1.46 times the size of the Fire Department
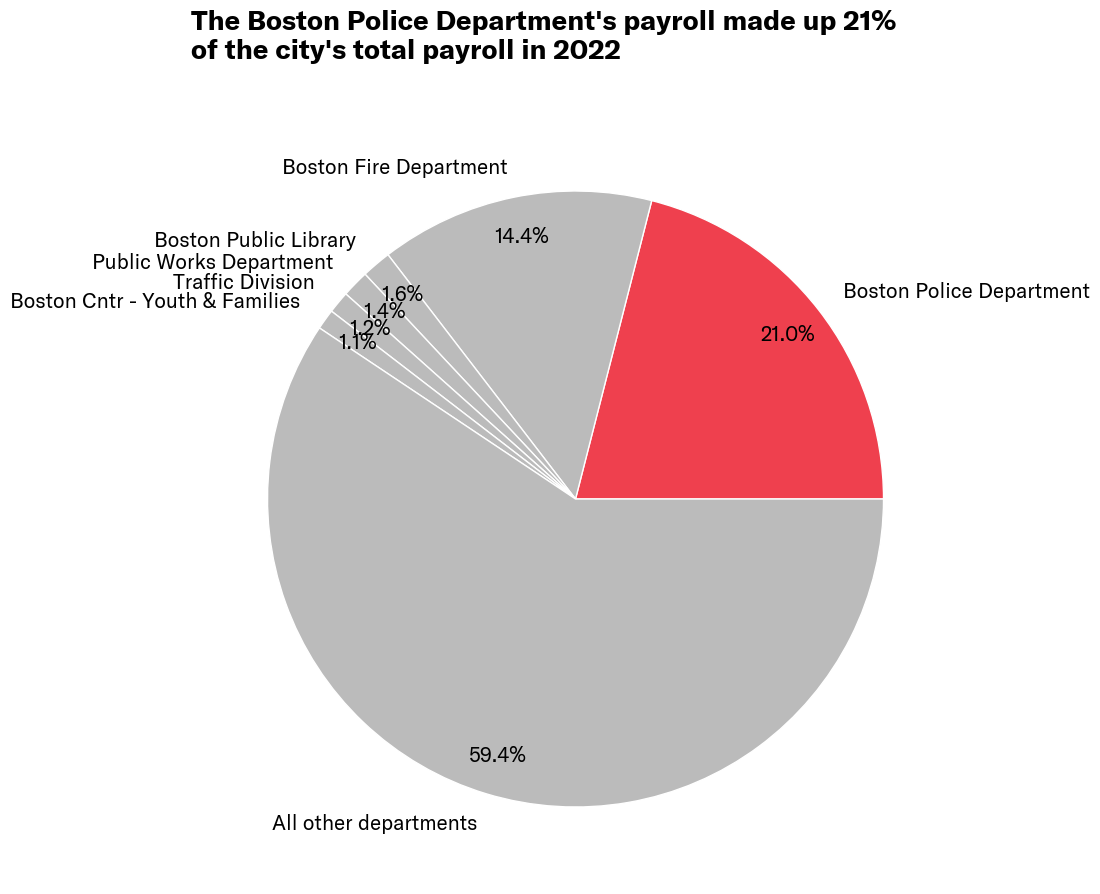
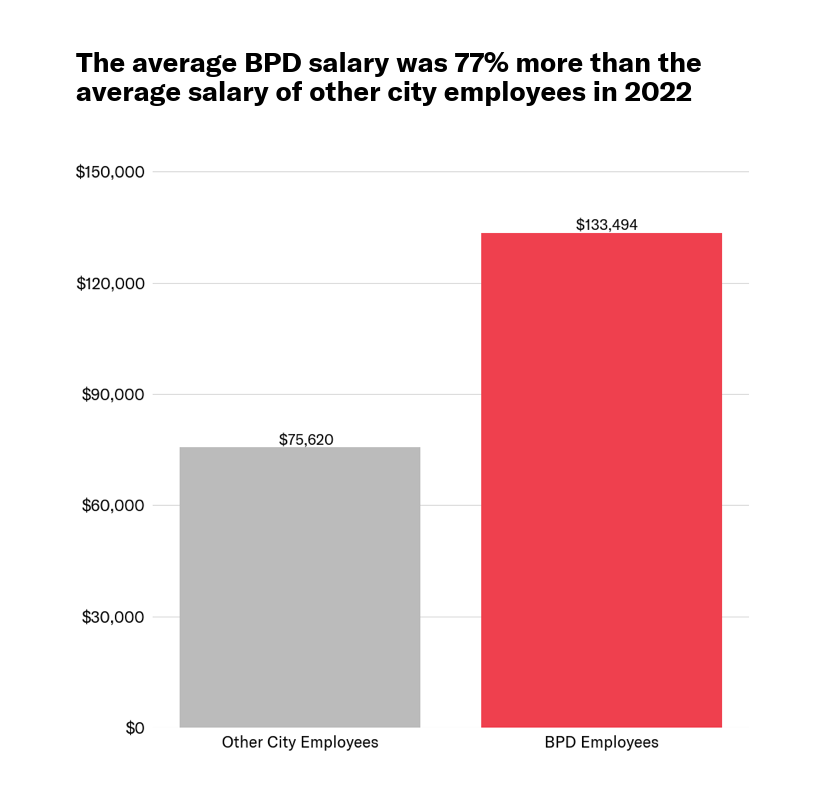
High payroll costs stemmed from both the large size of the department and the higher-than-average pay of employees—Boston Police Department employees made up 13% of the City’s total employees but department payroll made up 21% of the City’s total payroll.
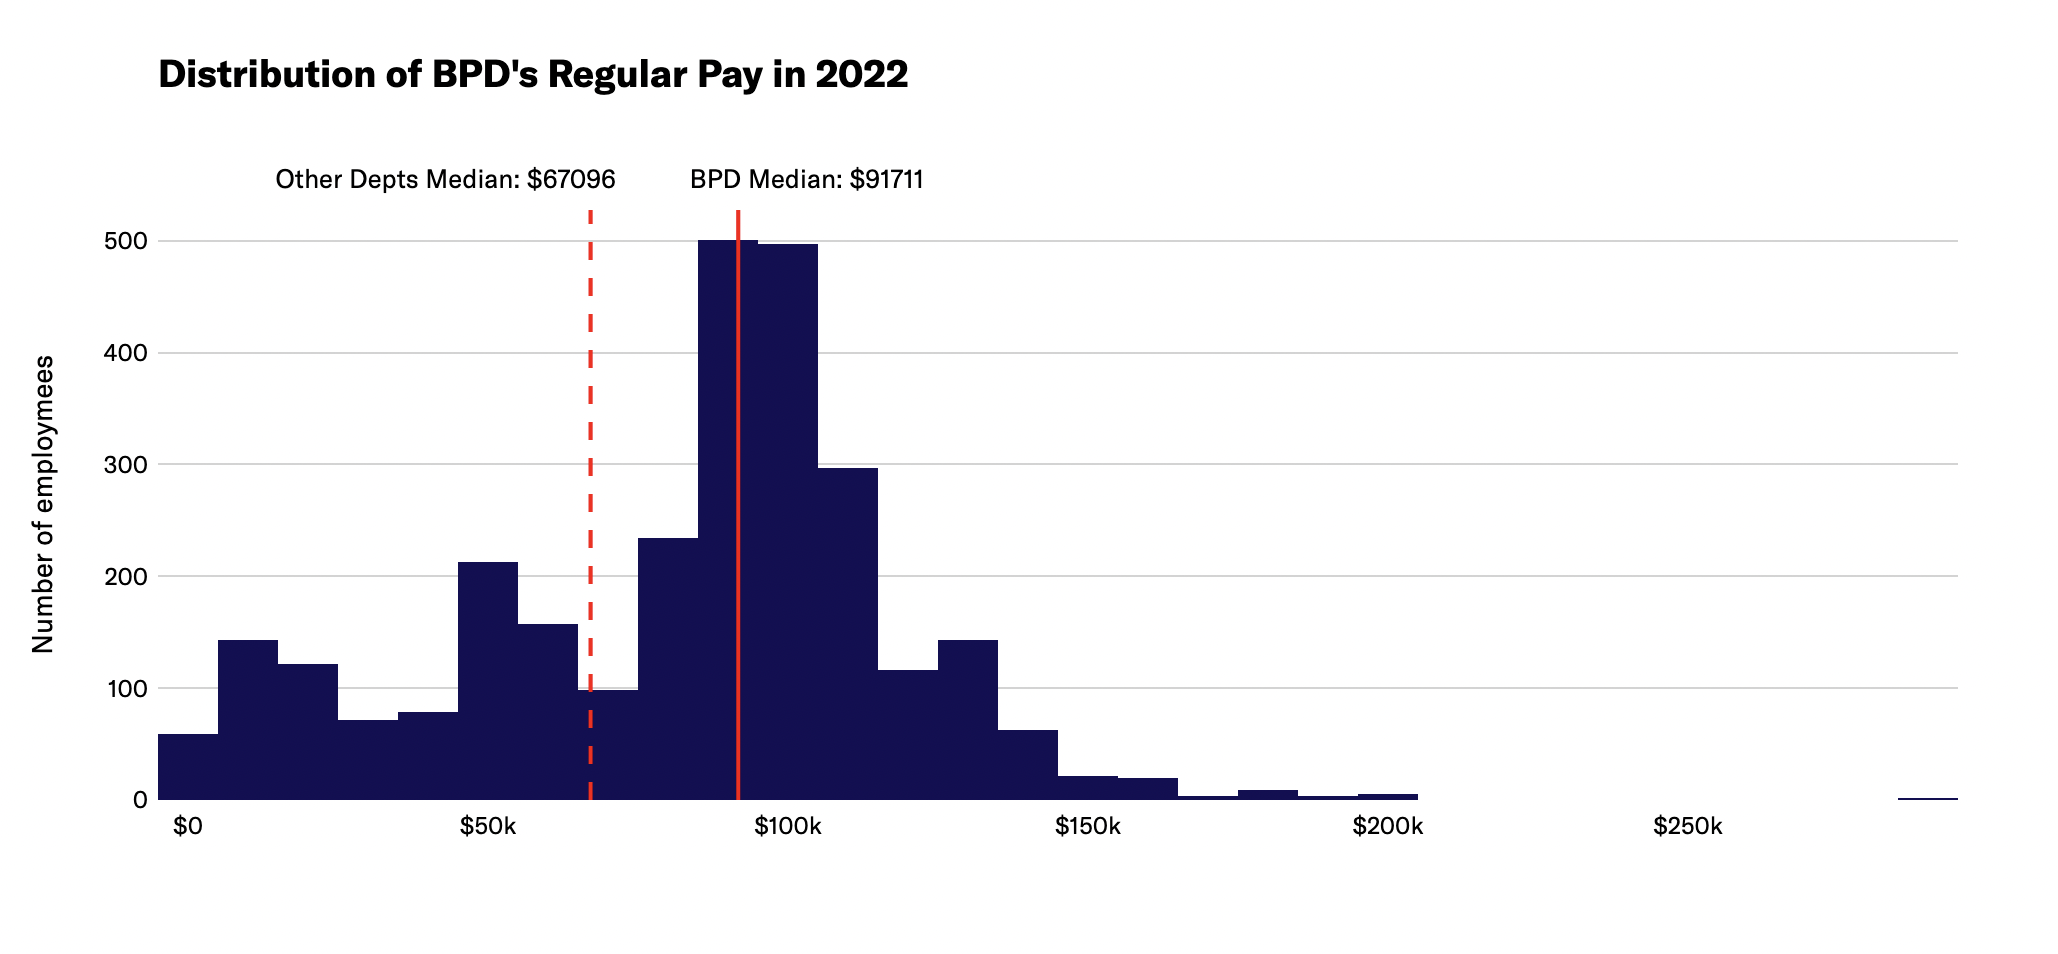
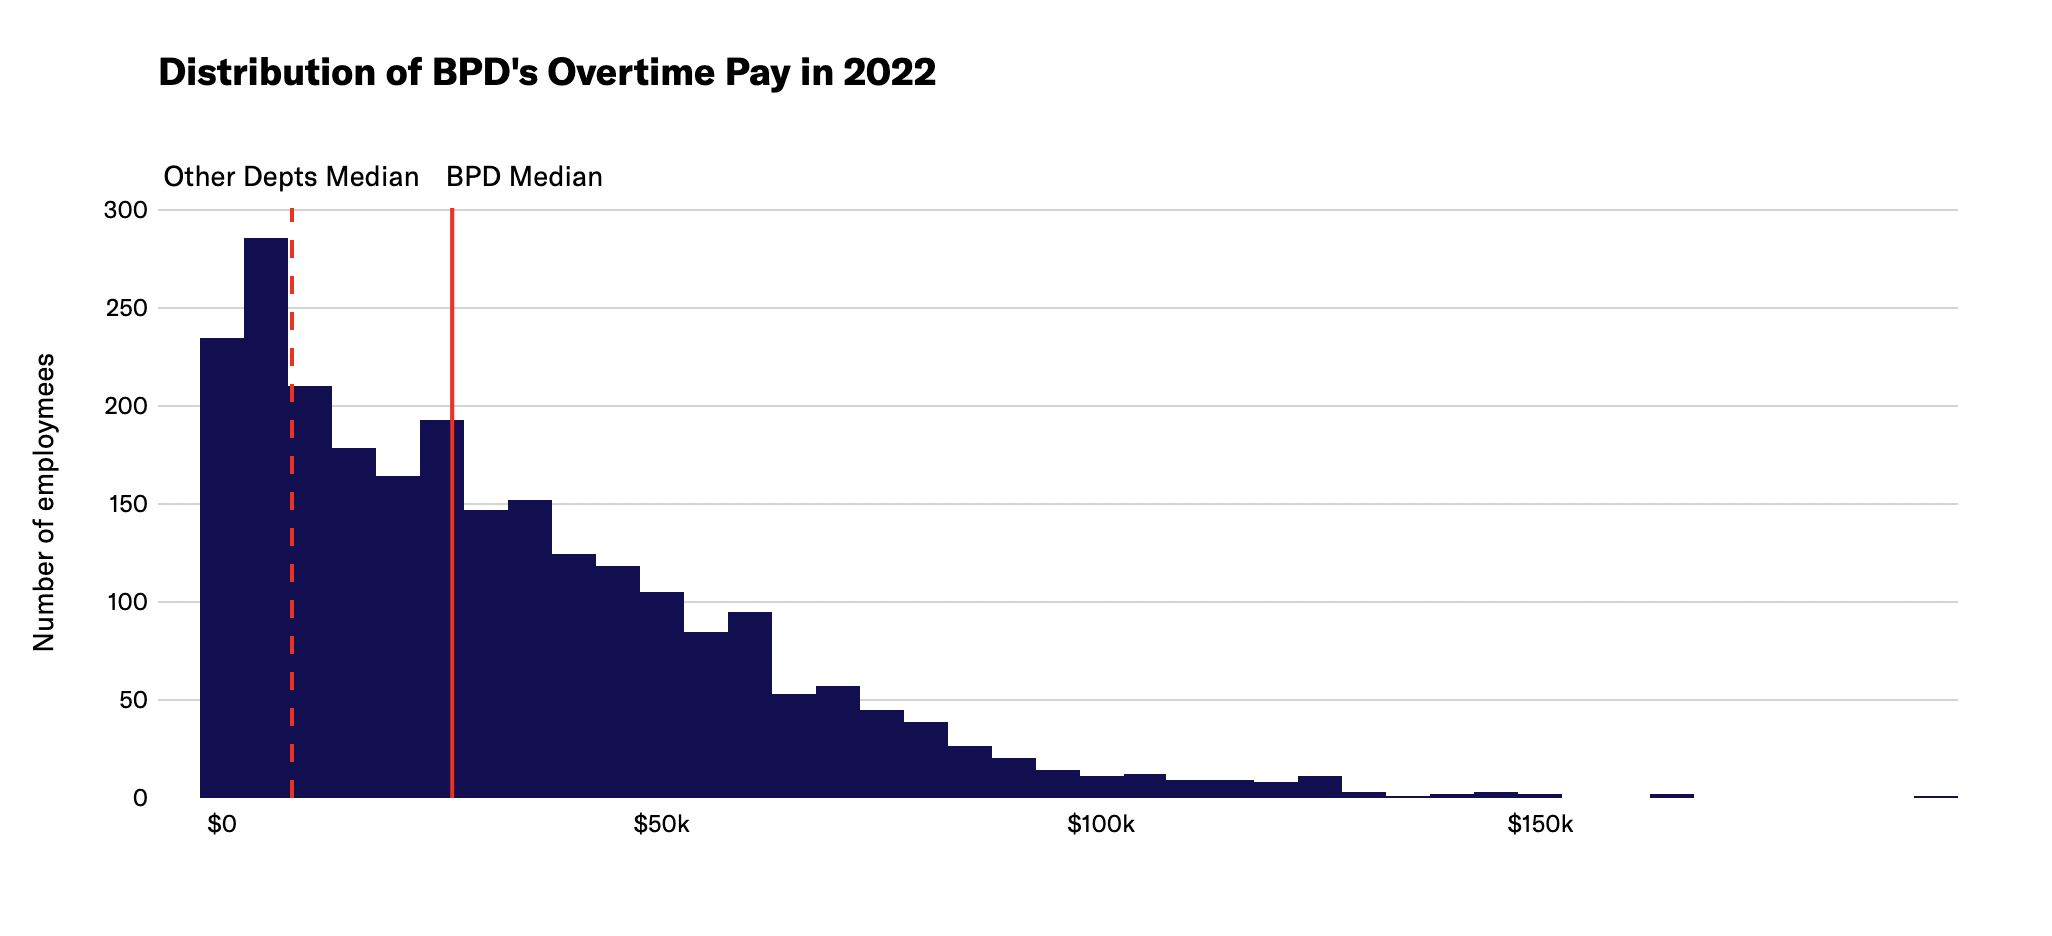
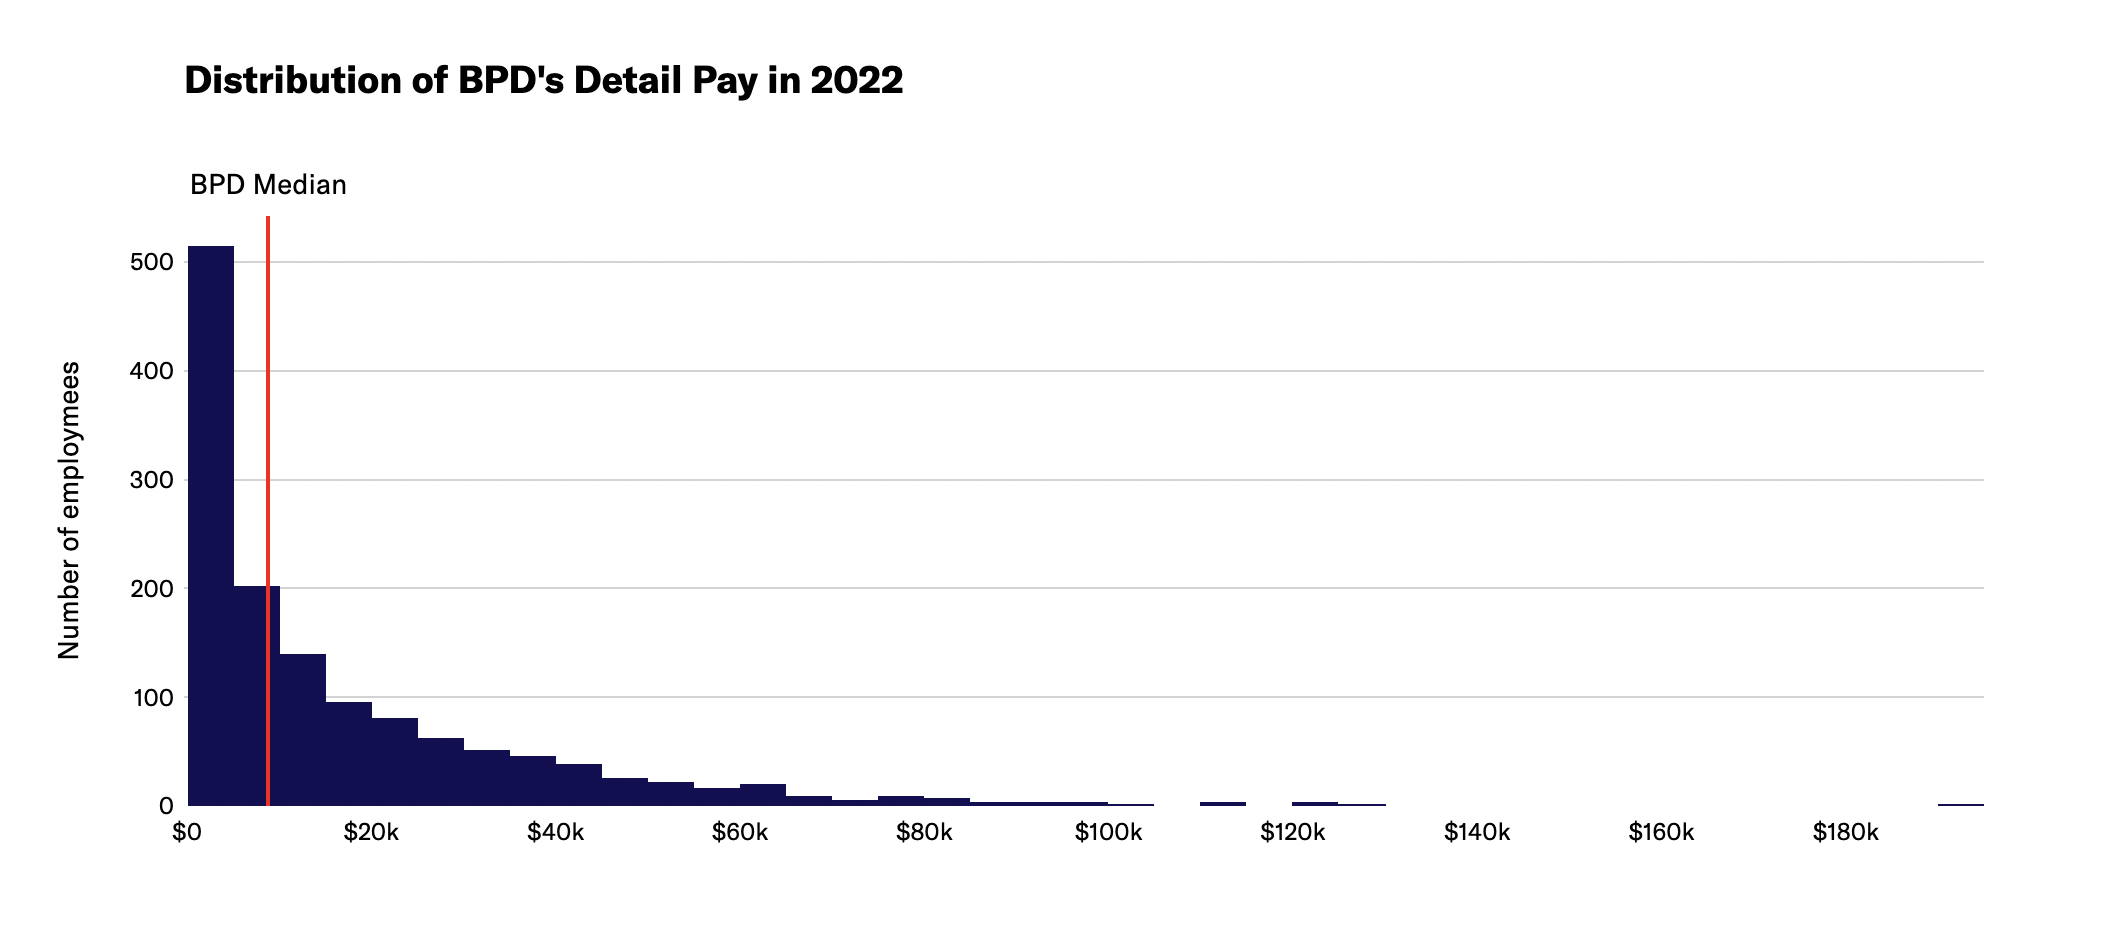
See below for distribution of department regular, overtime, and detail pay in 2022.
Police Department overtime expenditures regularly exceed the budgeted amount and fuel high payroll costs
BPD has exceeded their overtime budget in previous years. As of the May 2022 City Council hearing on the BPD budget, the department had already surpassed their FY2022 overtime budget by $10 million. At that time, it was anticipated that by the end of the fiscal year, overtime expenditures would be $66.8 million, $22.9 million over the $43.9 million budgeted for overtime spending. The City finds money to fund this police overspending every year—a privilege that is generally not afforded to other city departments.
Overtime spending and overspending does not occur by accident. In a December 2015 report, an audit of BPD described “overtime banks” with a planned number of hours in each district and specialized unit used to assign overtime to officers. Rather than just paying for unplanned emergency spending, the department plans in advance to use many overtime hours rather than managing the allotted overtime hours to stay within budget.
The City has yet to publish total overtime spending for FY2022 or to-date spending for FY2023, meaning information about actual overtime budget overages for these fiscal years is still unavailable. However, overtime data for calendar year 2022 is available, and from this we can see that police overtime made up a considerable amount of the City’s overall payroll.
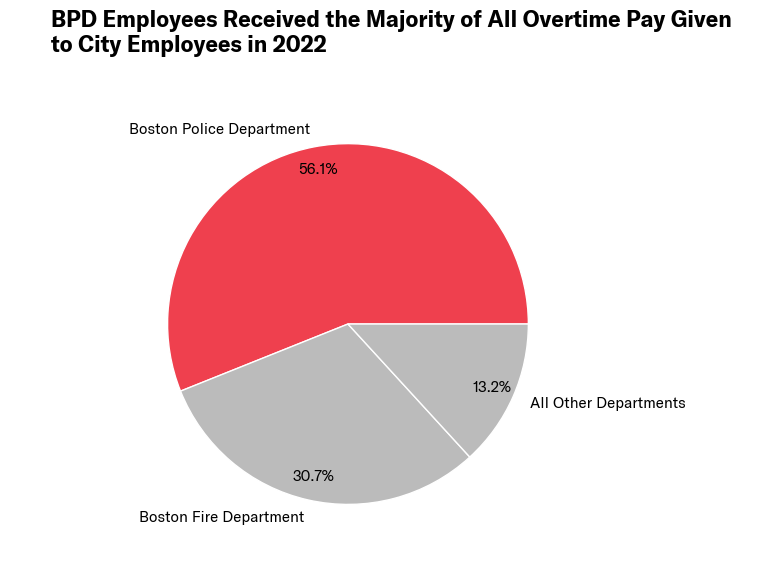
In 2022, 56% of all City overtime pay went to Boston Police Department employees.
Overtime pay still made up a substantial portion of Police Department employee pay; 19.3% of department payroll was for overtime. While most City employees’ overtime is capped as a percentage of their salary, this is not true of police officers. This leads to very high pay for officers who obtain overtime hours to increase their pay and is a major reason that police regularly are the highest paid employees in the City. Despite the size of this overtime spending, the Police Department has historically not been transparent about its processes for managing overtime.
Overtime also continues to be a significant contributor to the pay of the department’s top earners.
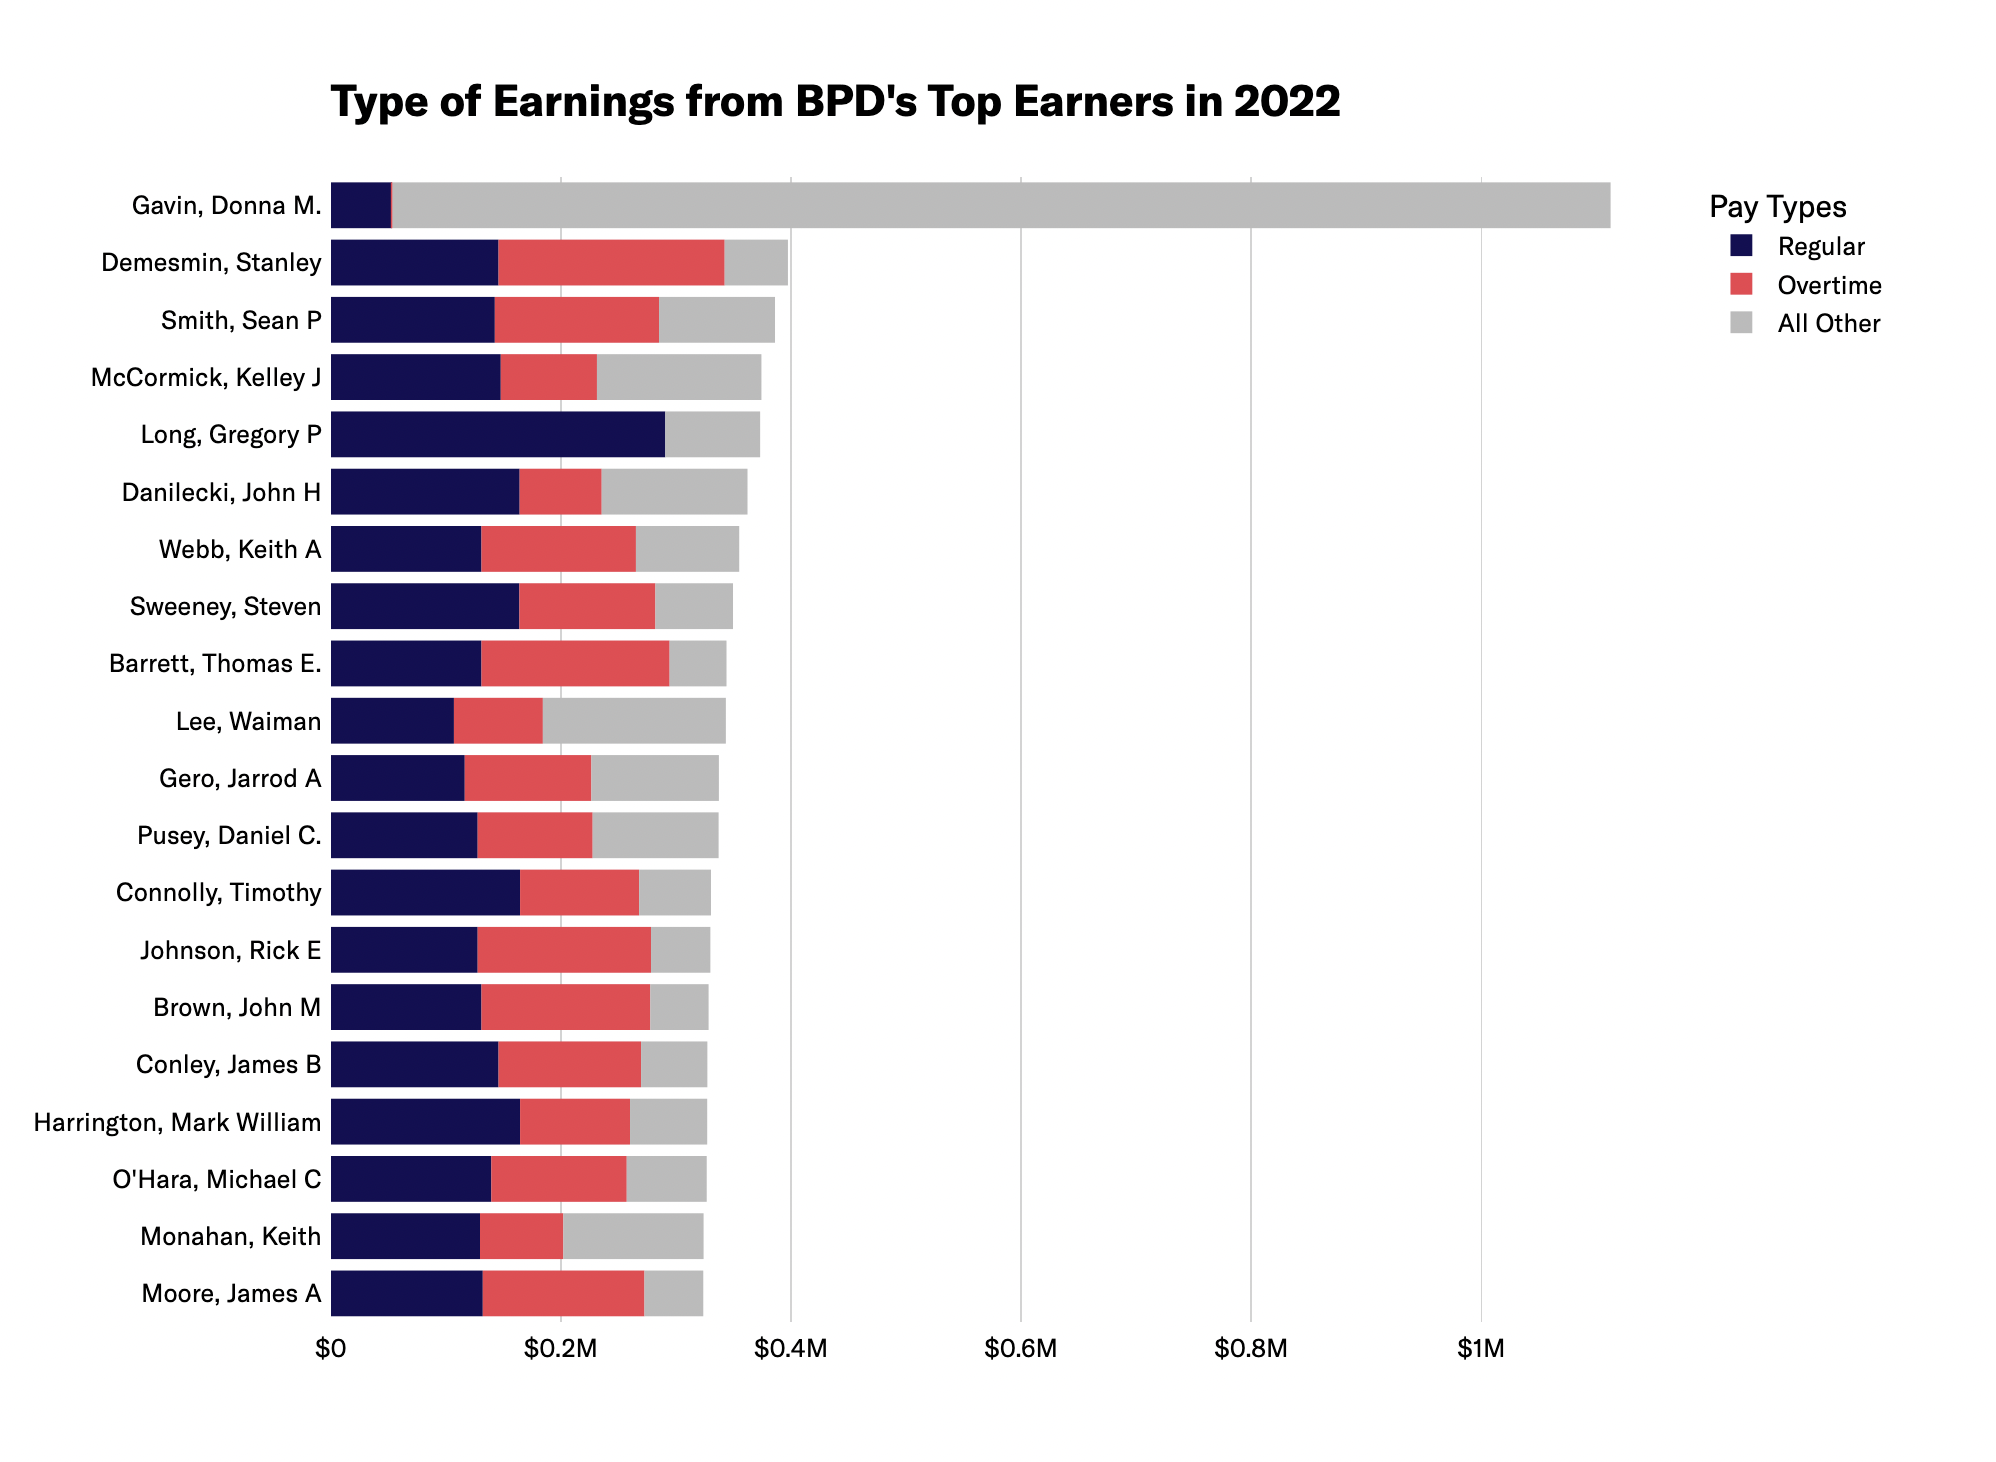
Note: As the result of a gender discrimination lawsuit, the city was ordered to pay millions to Donna M. Gavin, who makes the top earner on this list.
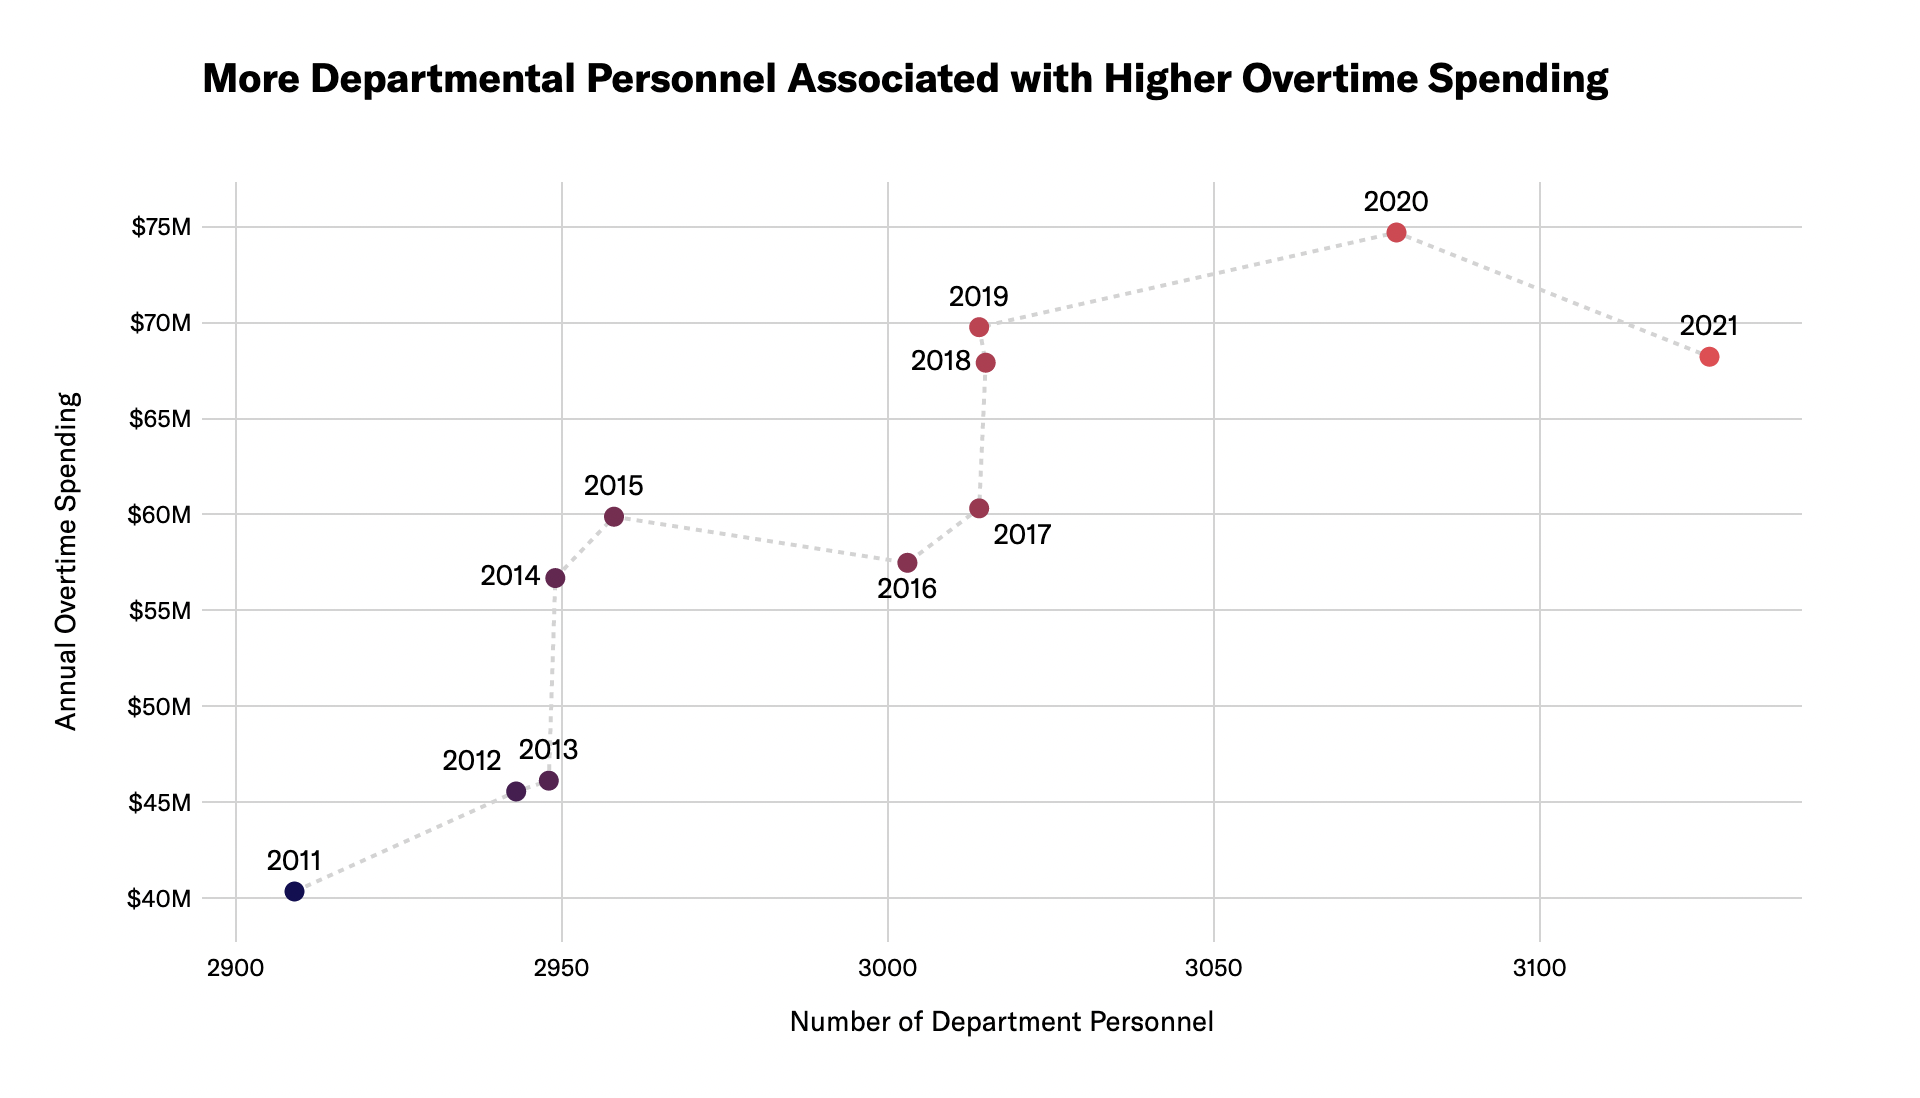
Data suggest hiring more Police Department employees isn’t the solution to overtime spending
At last year’s BPD budget hearings, City Council President Ed Flynn repeated the suggestion that hiring more police officers would help to address excessive overtime costs. But this idea—that BPD’s overtime problem is caused by a shortage of officers—is not supported by the data.
Looking at historical budget data, years with more Boston Police Department personnel are actually associated with higher overtime spending. This new finding adds to our 2021 analysis, which measured departmental size as the full-time equivalents (FTEs) at the BPD and found that there was no correlation between number of Police Department FTEs and overtime spending.
Boston has a larger-than-average police department
Higher staff numbers at BPD have not reduced overtime spending. But misguided claims about overtime spending aren’t the only reasons some City Councilors are calling for more police officers. To contextualize these calls for more officers, we conducted a review of similarly situated communities to see how Boston stacks up. That review shows the Boston Police Department already has a sizable staff.
It is a large department when viewed against other cities with comparable population sizes. A review of available FBI UCR data shows that between 2015 and 2021 Boston consistently retained more officers per resident than the average of other similarly sized cities.
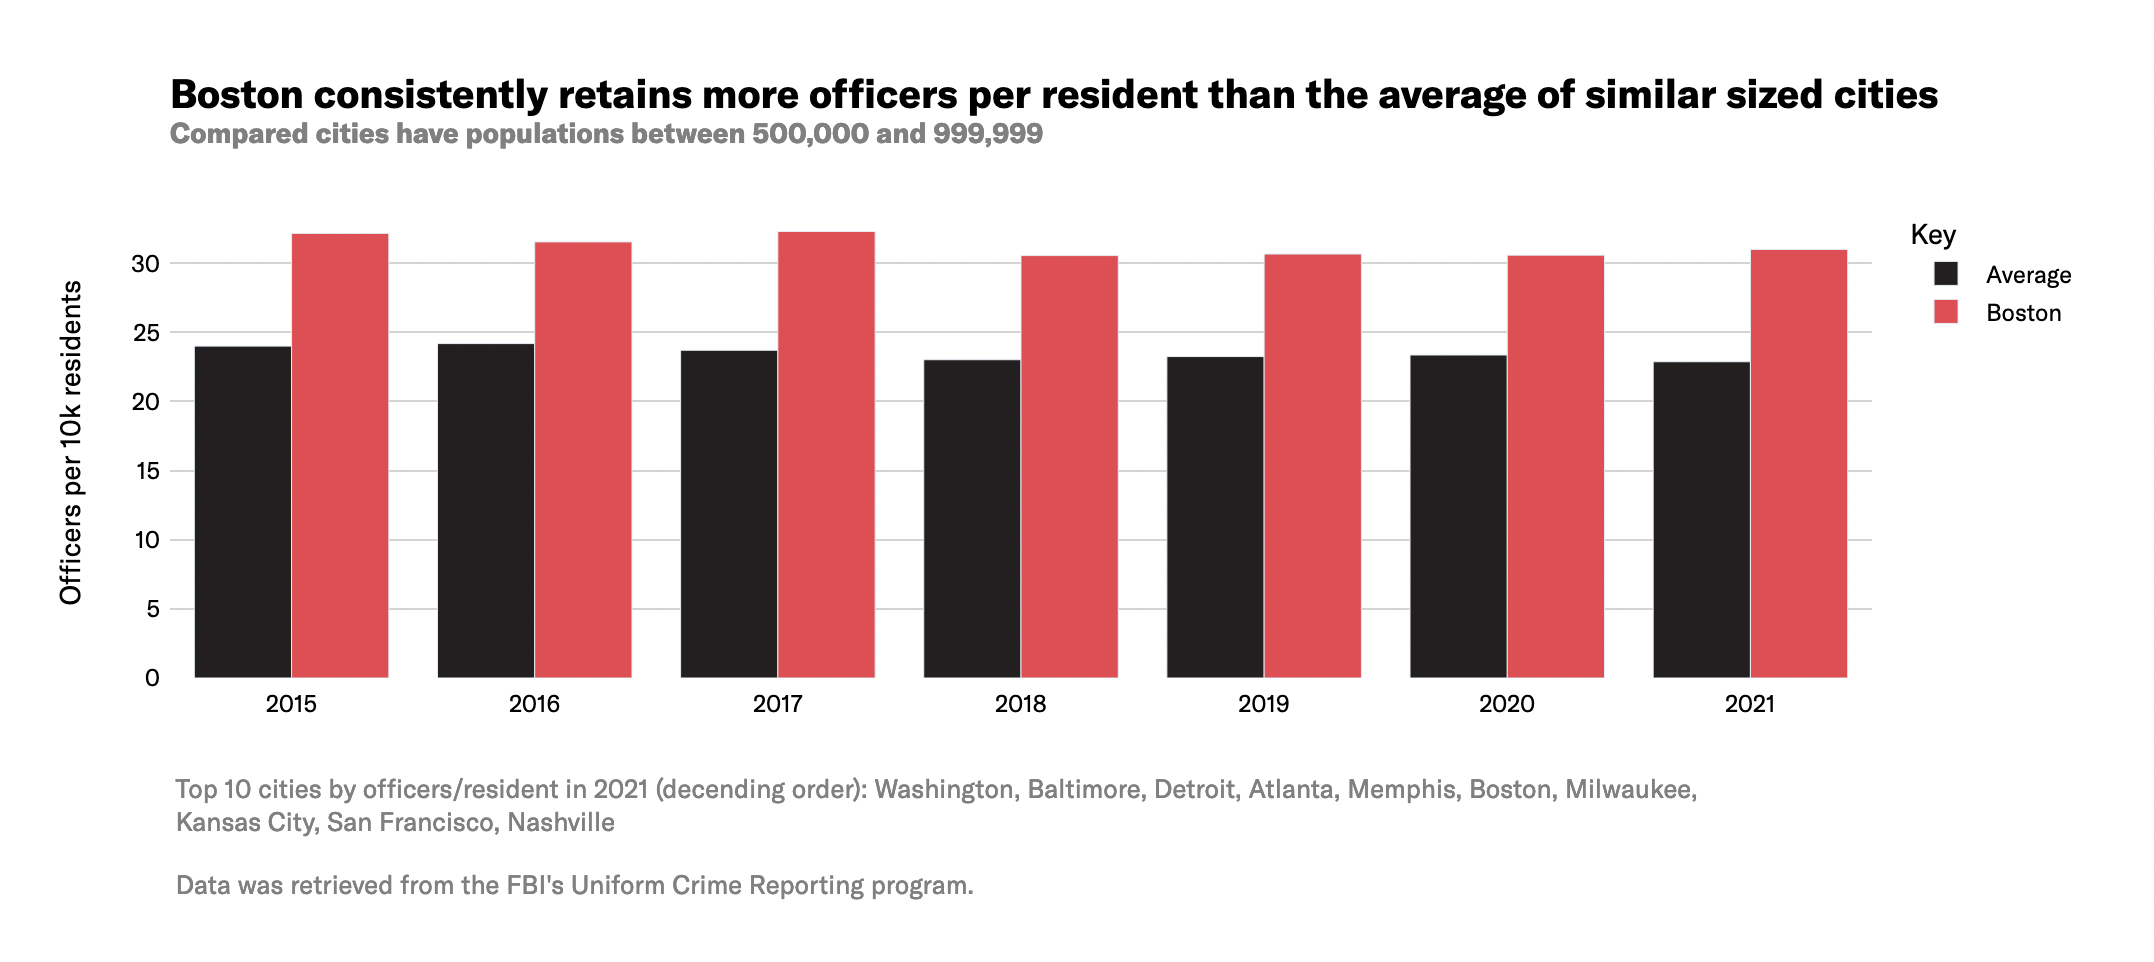
Note: The 23 cities compared were Washington, Baltimore, Detroit, Atlanta, Memphis, Milwaukee, Kansas City, San Francisco, Nashville, Honolulu, Denver, Charlotte, Fort Worth, Albuquerque, El Paso, Oklahoma City, Mesa, Louisville, Seattle, Tucson, Fresno, Sacramento, and Portland.
In 2021, Boston retained more officers per resident than 70% of other similarly sized cities.
Overall, the adopted FY2023 budget for police spending was similar to previous years: costly, with a bloated payroll and tens of millions of dollars for overtime. We’ll soon see how the proposed FY2024 budget compares; the first look will come on or before April 12, 2023 when Mayor Wu submits her budget recommendation to the City Council. We plan to share an analysis of that budget proposal after it becomes available.
Members of the public will have the opportunity to directly share their input on the budget during public hearings, which are expected to be held at the Boston City Council between April and June.
Data Sources
- Boston’s open data portal
-
- Adopted FY2023 operating budget
- City of Boston 2021 and 2022 employee earnings report
- Boston’s City budget website
-
- Current and past fiscal year budgets at bottom of page; information was obtained from the public safety cabinet section of the budget documents
-
- Law Enforcement Employees data
This report was authored by Natasha (ACLUM) and Ryan Yap (Boston University). Data analysis was conducted by Boston University students including Ryan Yap, Xiang Li, Zijie Li, and Hayden Rothman under the supervision of the BU Spark! Program based at the BU Faculty of Computing & Data Sciences and led by Ziba Cranmer (BU) with project management support from Yagev Levi.
The analysis benefitted from crucial feedback from Fatema Ahmad (MJL), Lauren Chambers (UC Berkeley I School; ACLUM), and Youth Justice and Power Union.

Massachusetts Arrest Records Signal Troubling Racial Disparities
New analysis from students at the Boston University Spark! Lab and the ACLU of Massachusetts Data for Justice Project reveal troubling racial disparities in arrests in communities across Massachusetts. Our analysis uses data newly available thanks to ACLU advocacy in 2018, which led to the inclusion in that year’s omnibus criminal law reform legislation of language mandating the collection and reporting of statewide arrest data.
Section 5 of Chapter 69 of the Massachusetts General Laws requires all police departments to collect and report arrest data statistics to the Executive Office of Public Safety and Security (EOPSS), which is required to post this information online. These records allow residents, researchers, advocates, lawmakers, journalists and other interested parties to see how specific police departments use their arrest powers and enable us to conduct statewide reviews to compare departments to one another.
Arrests data from 2020 show signs of significant racial disparities.
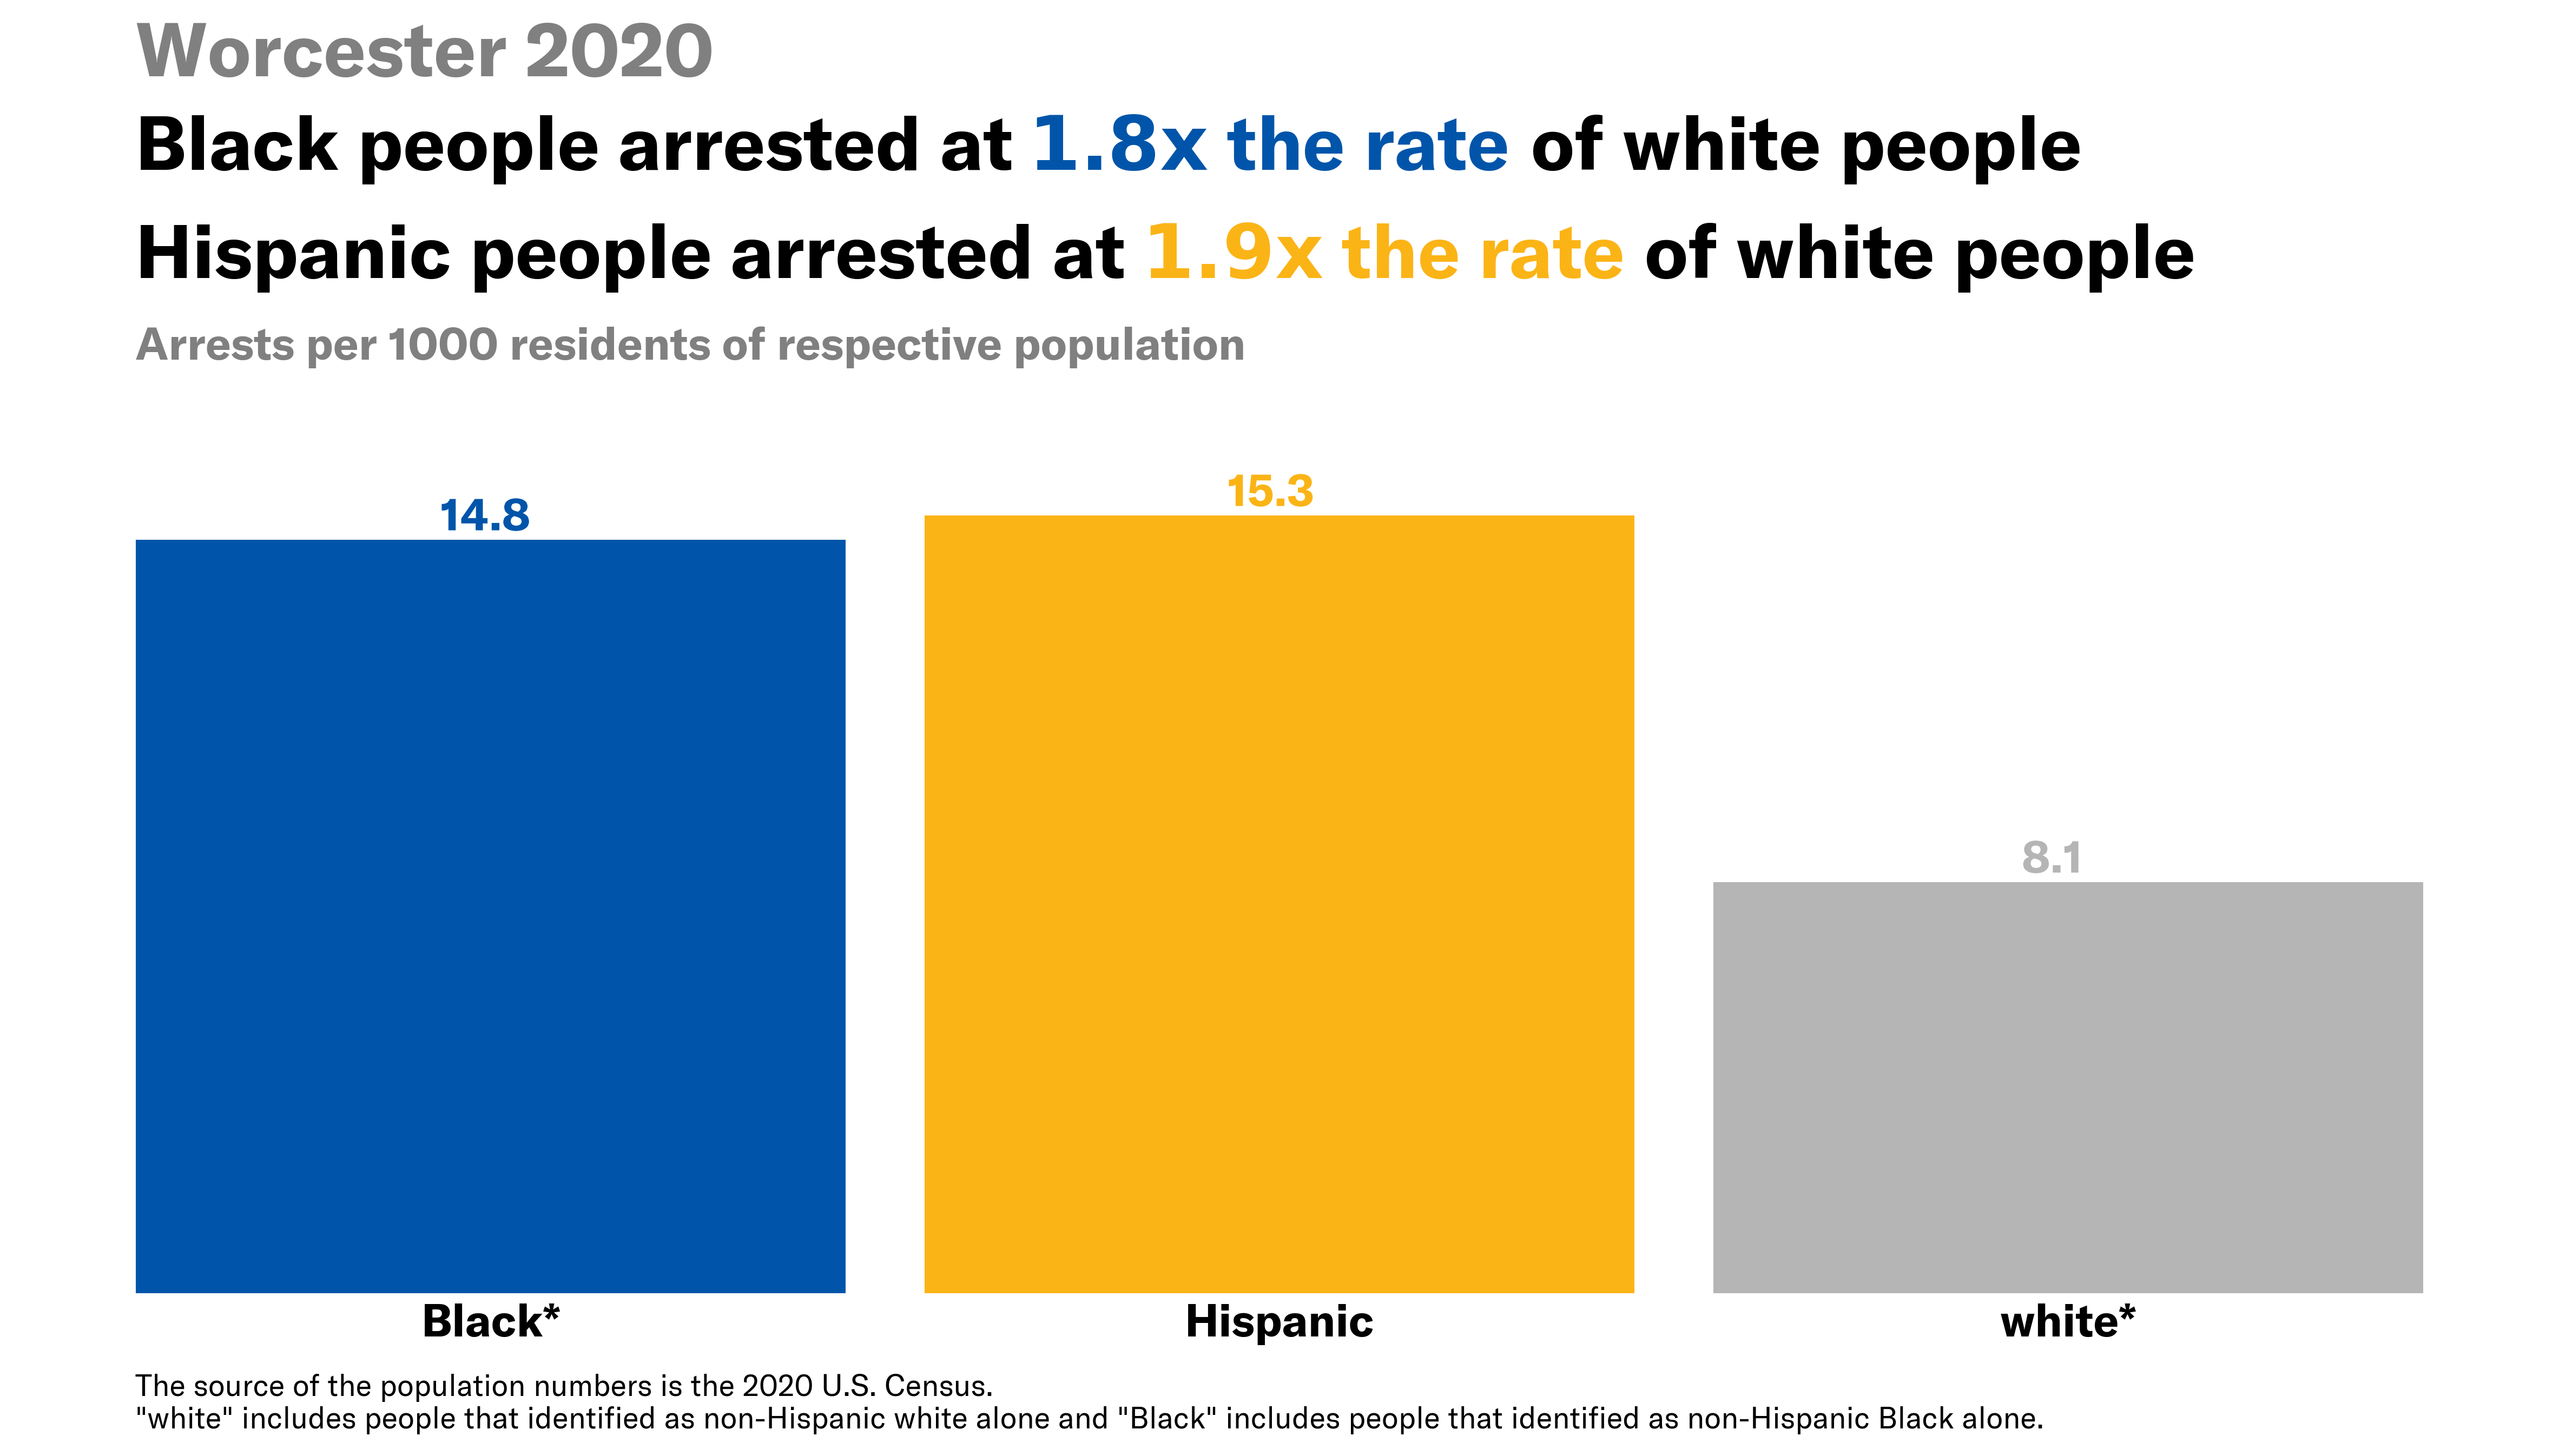
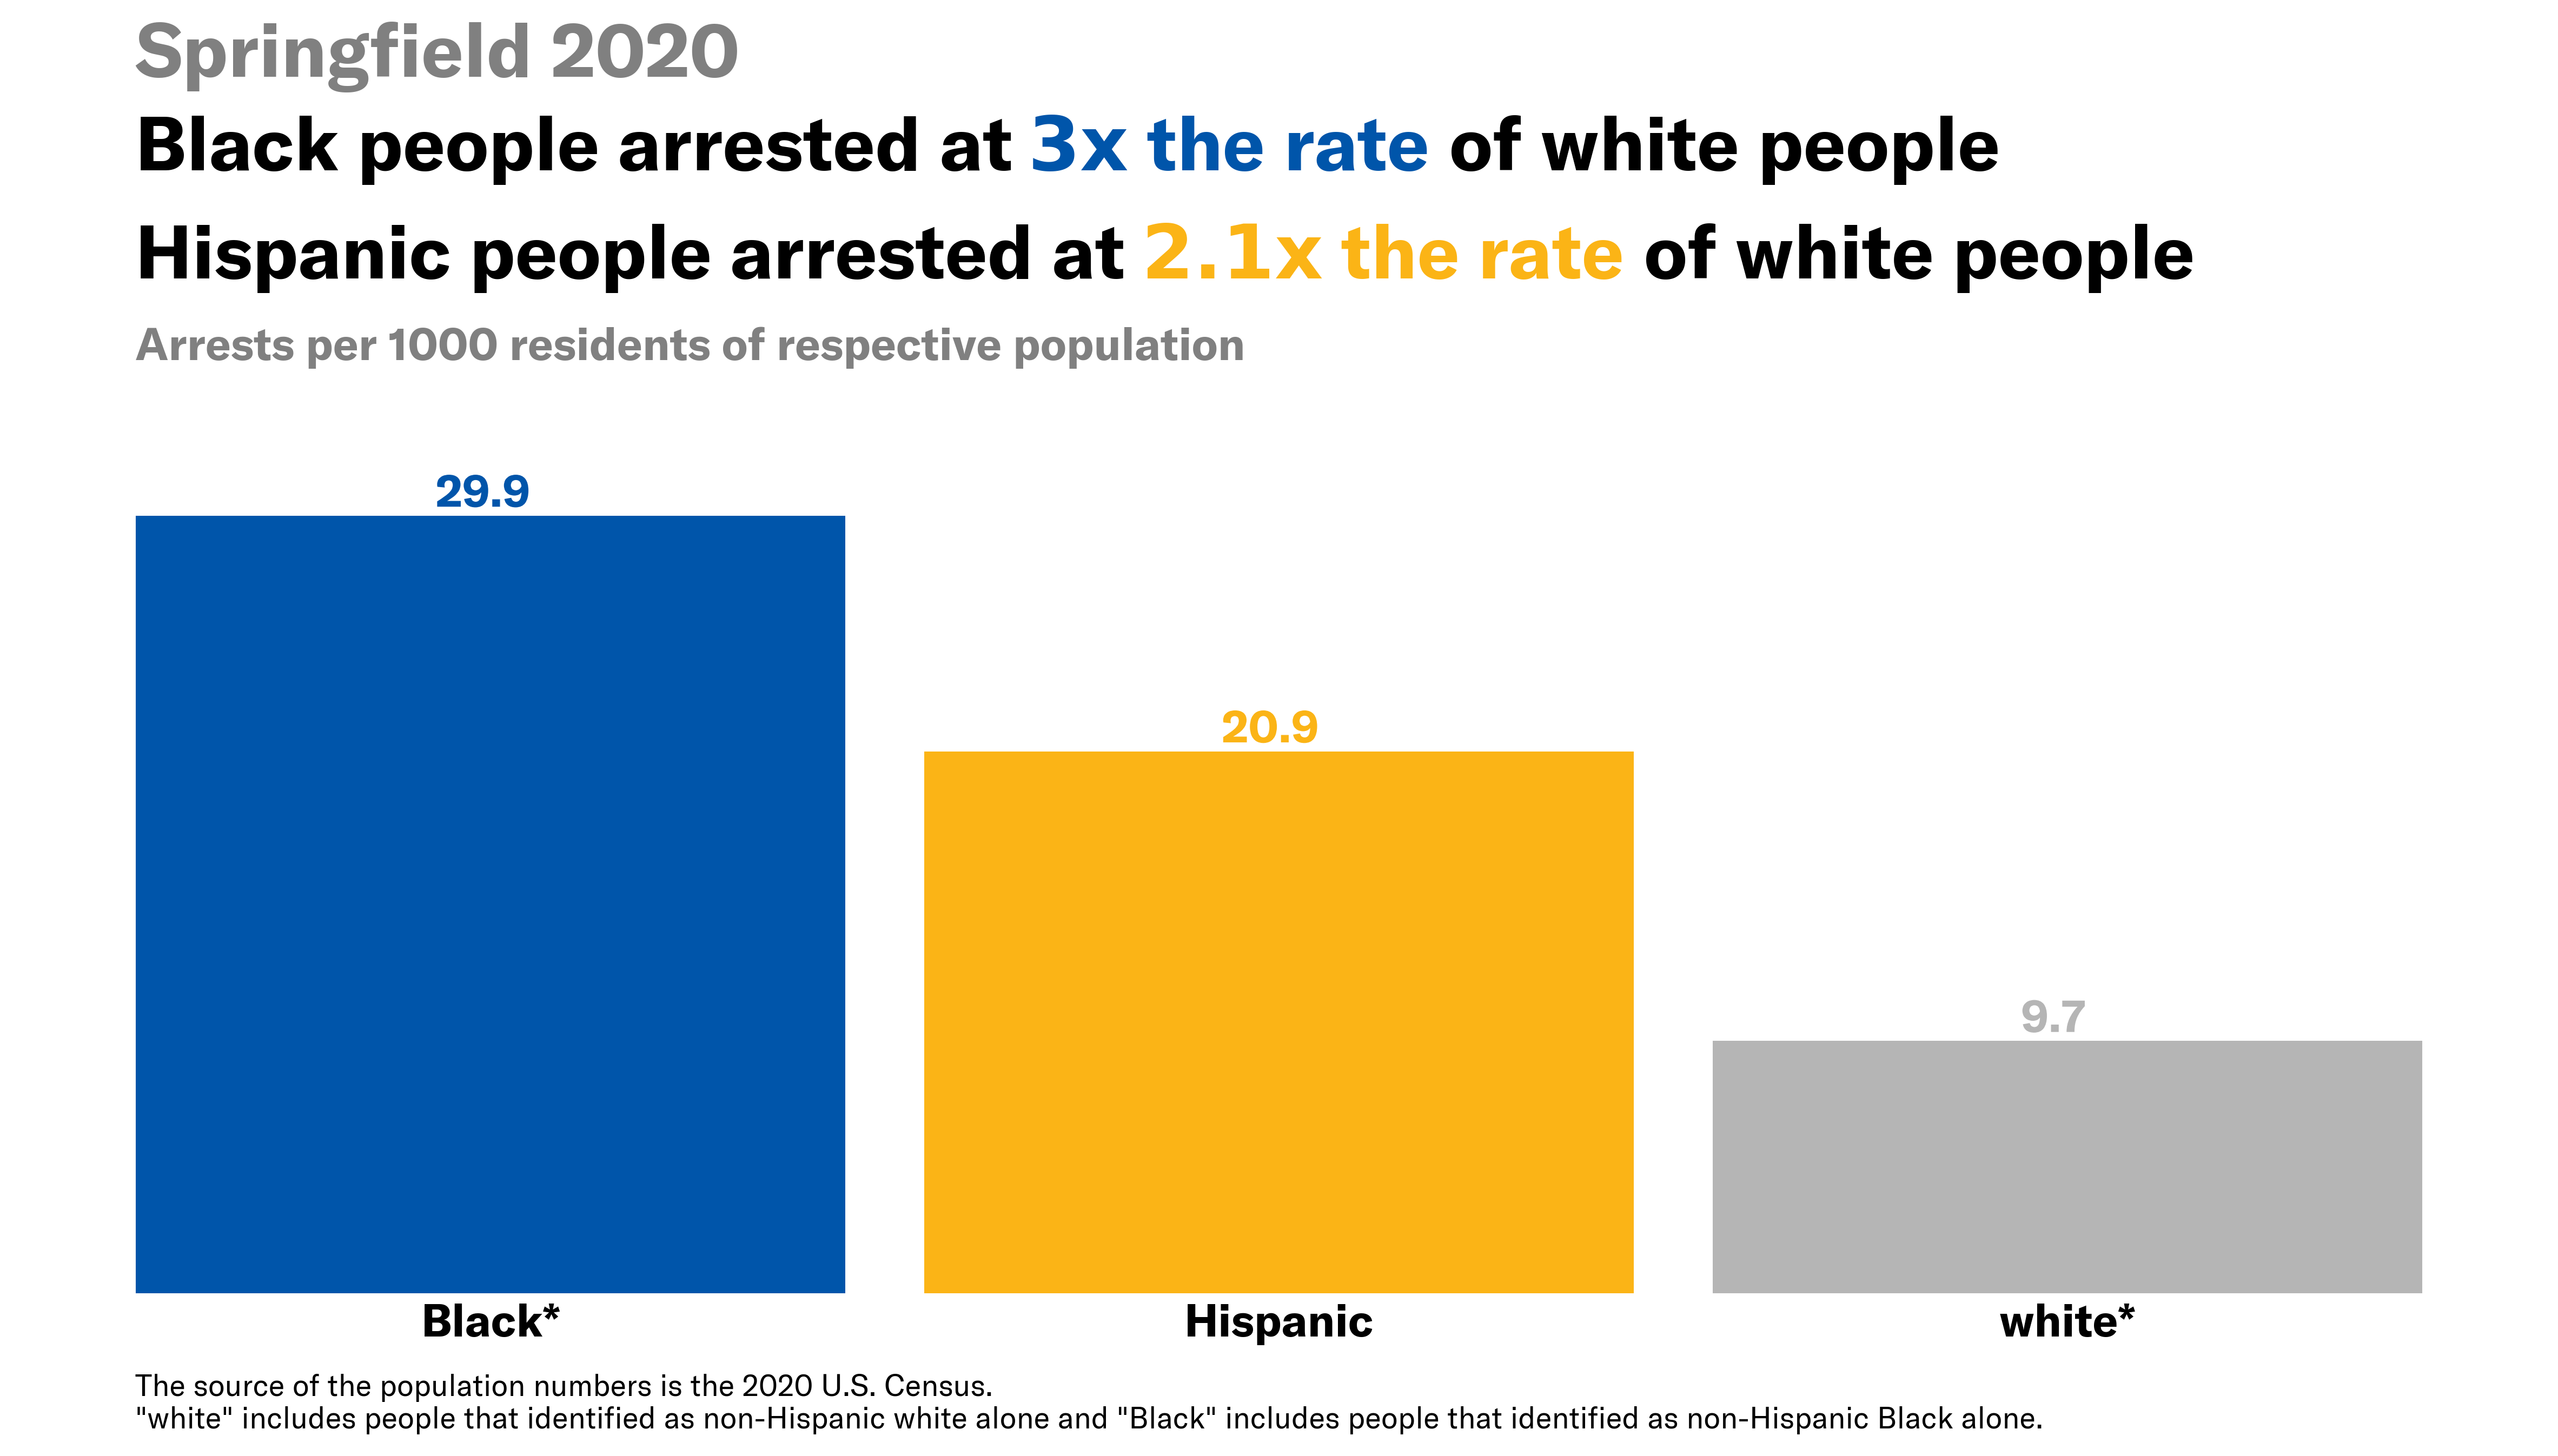
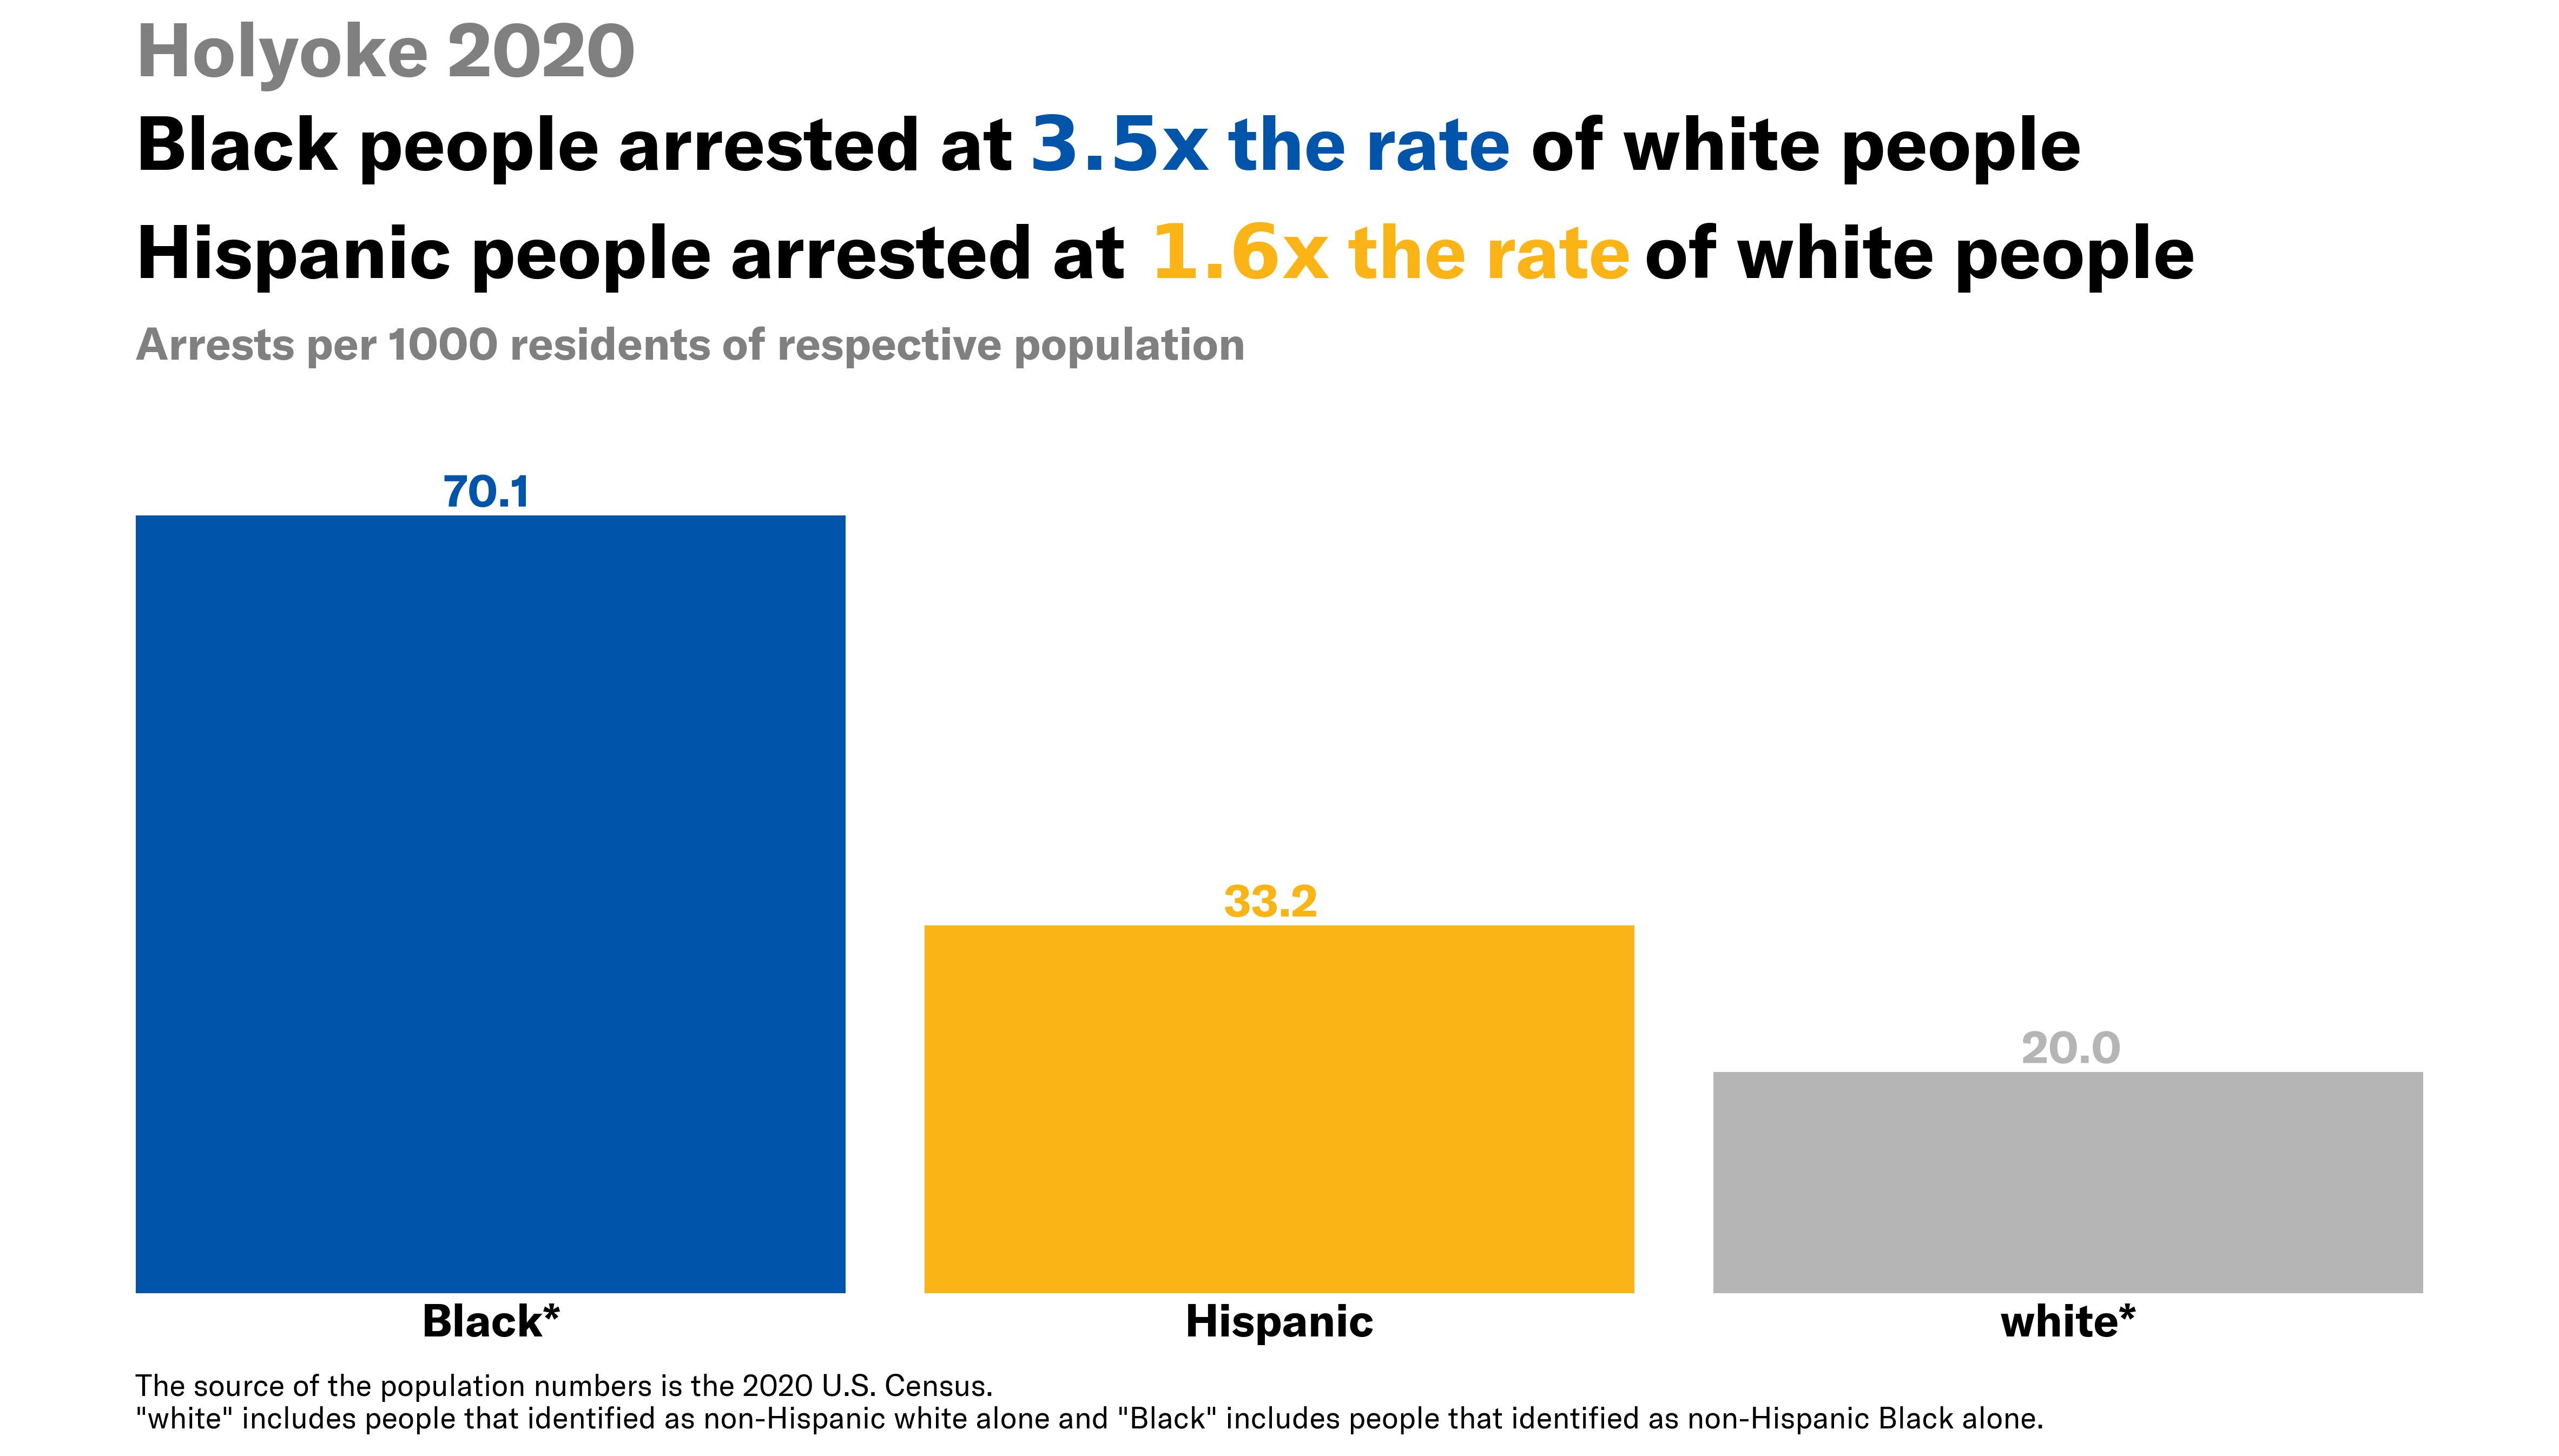
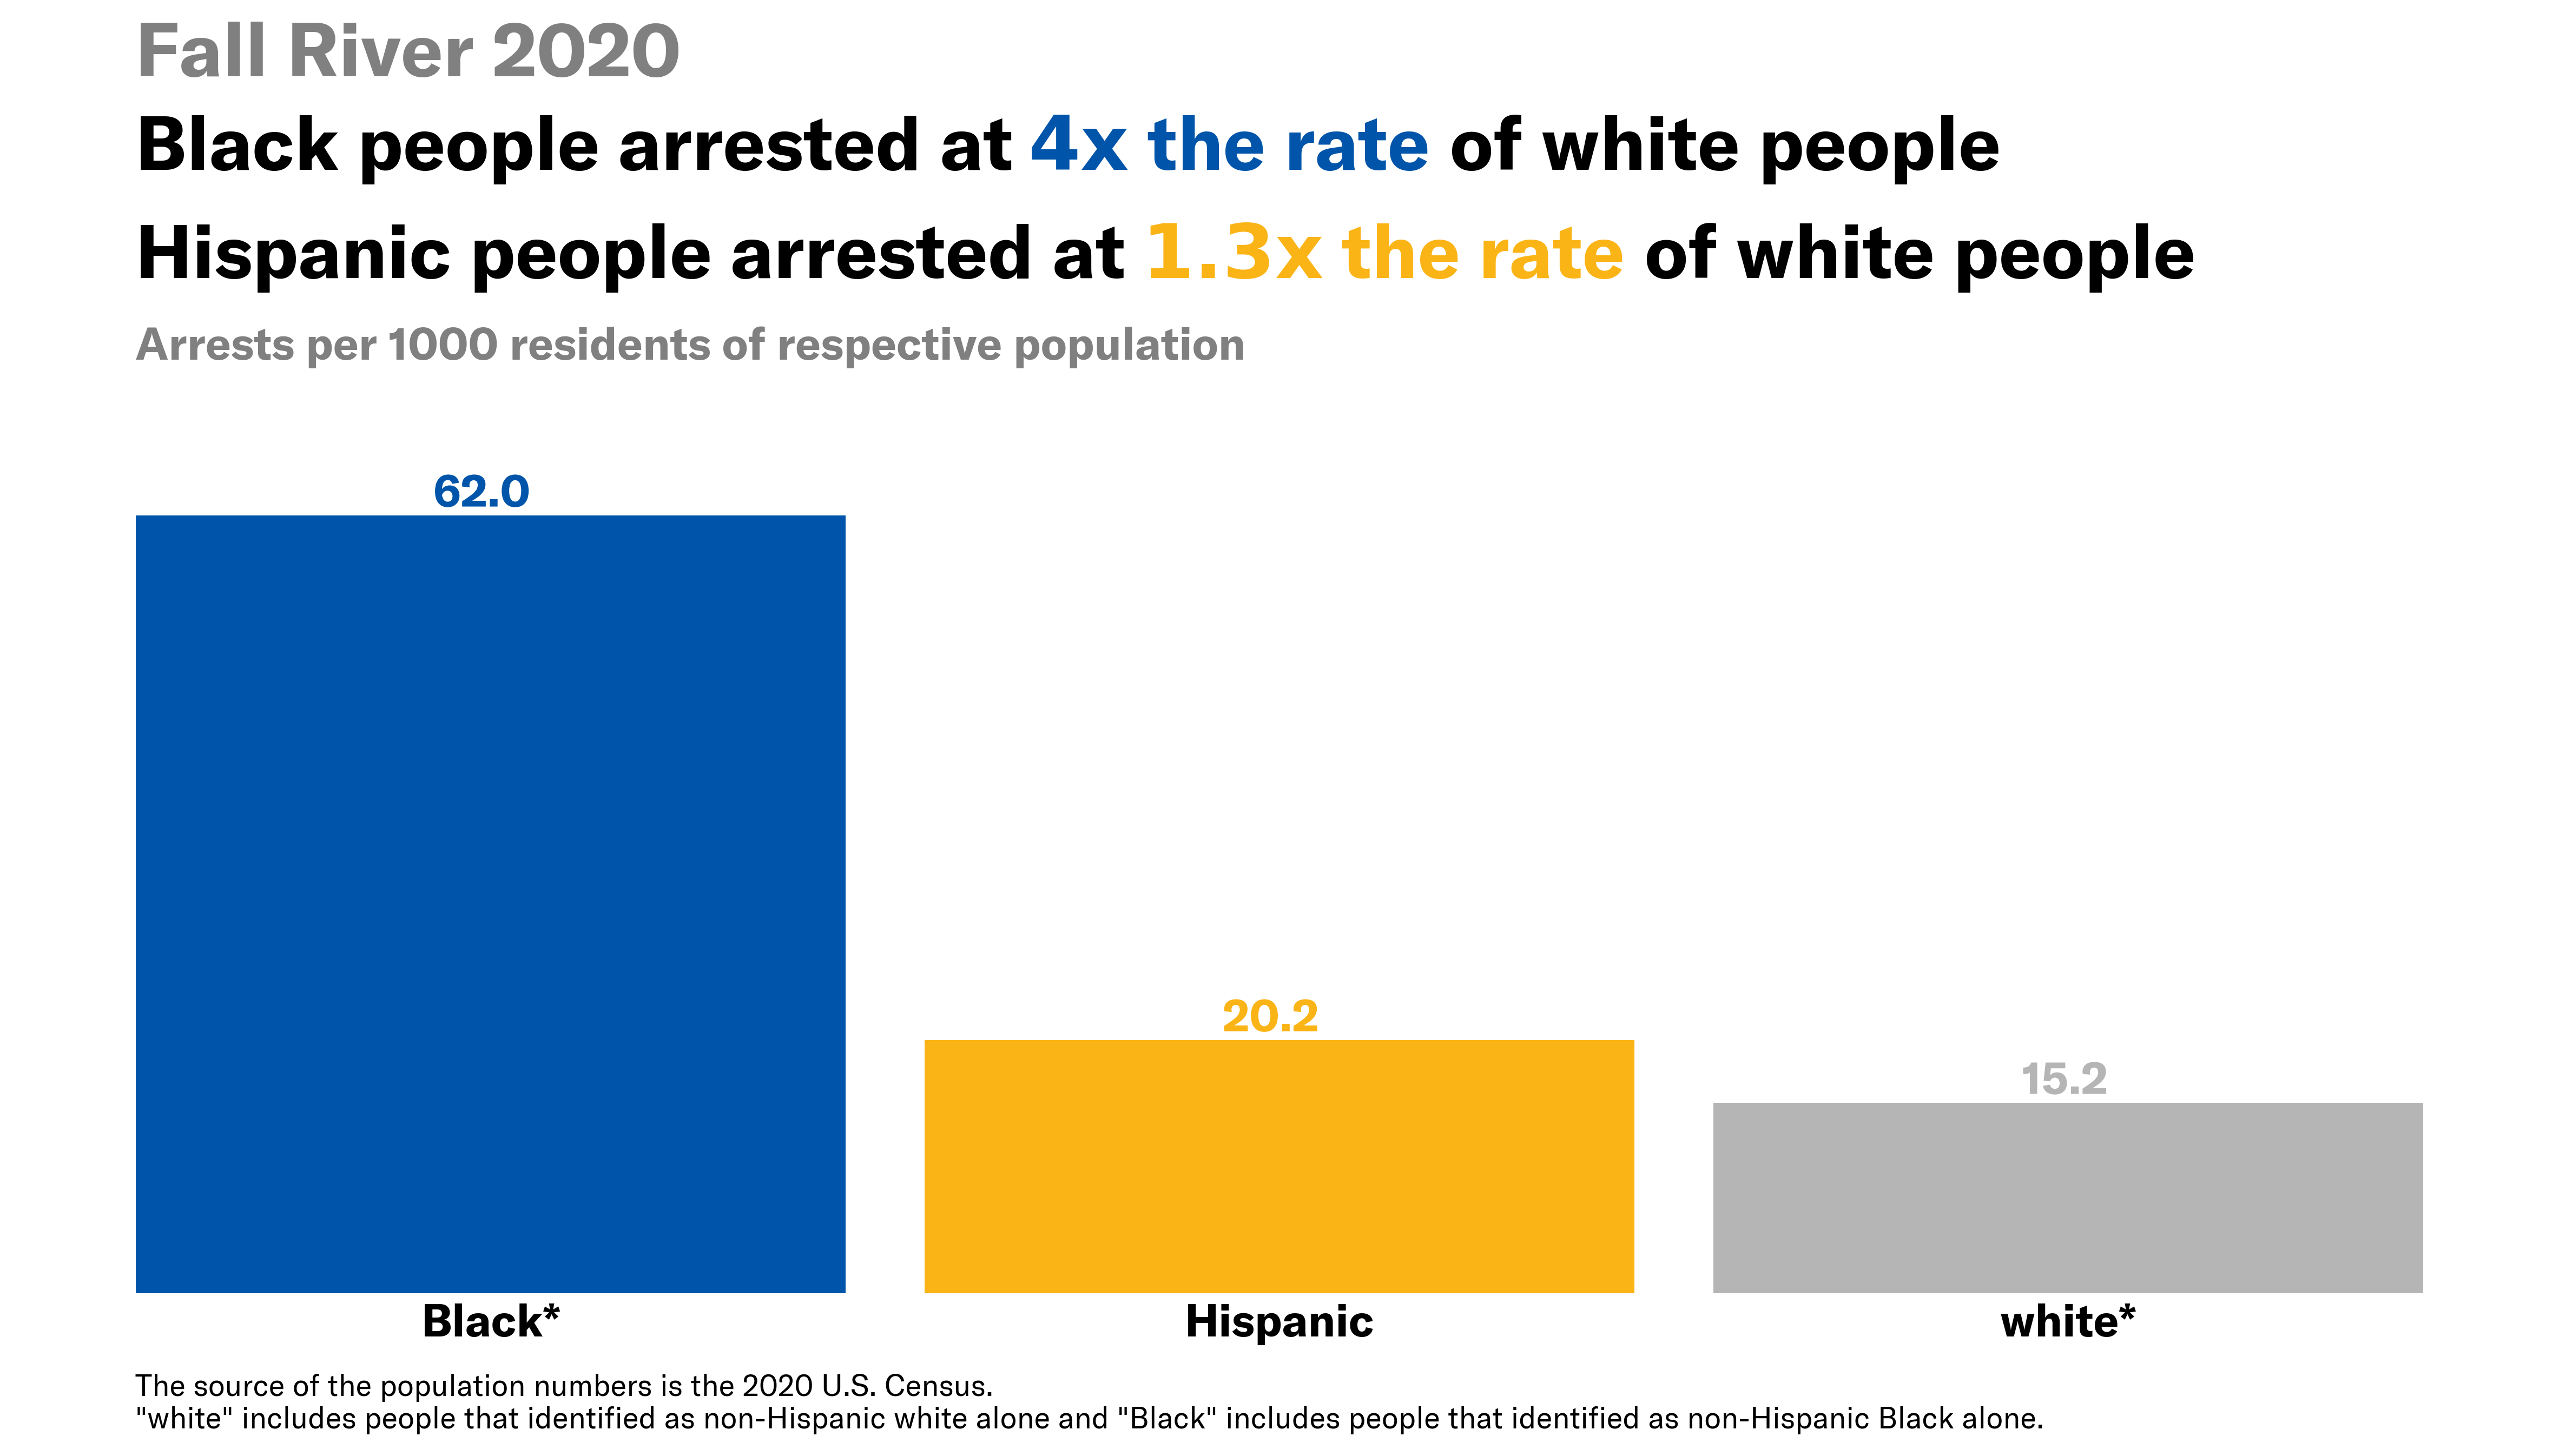
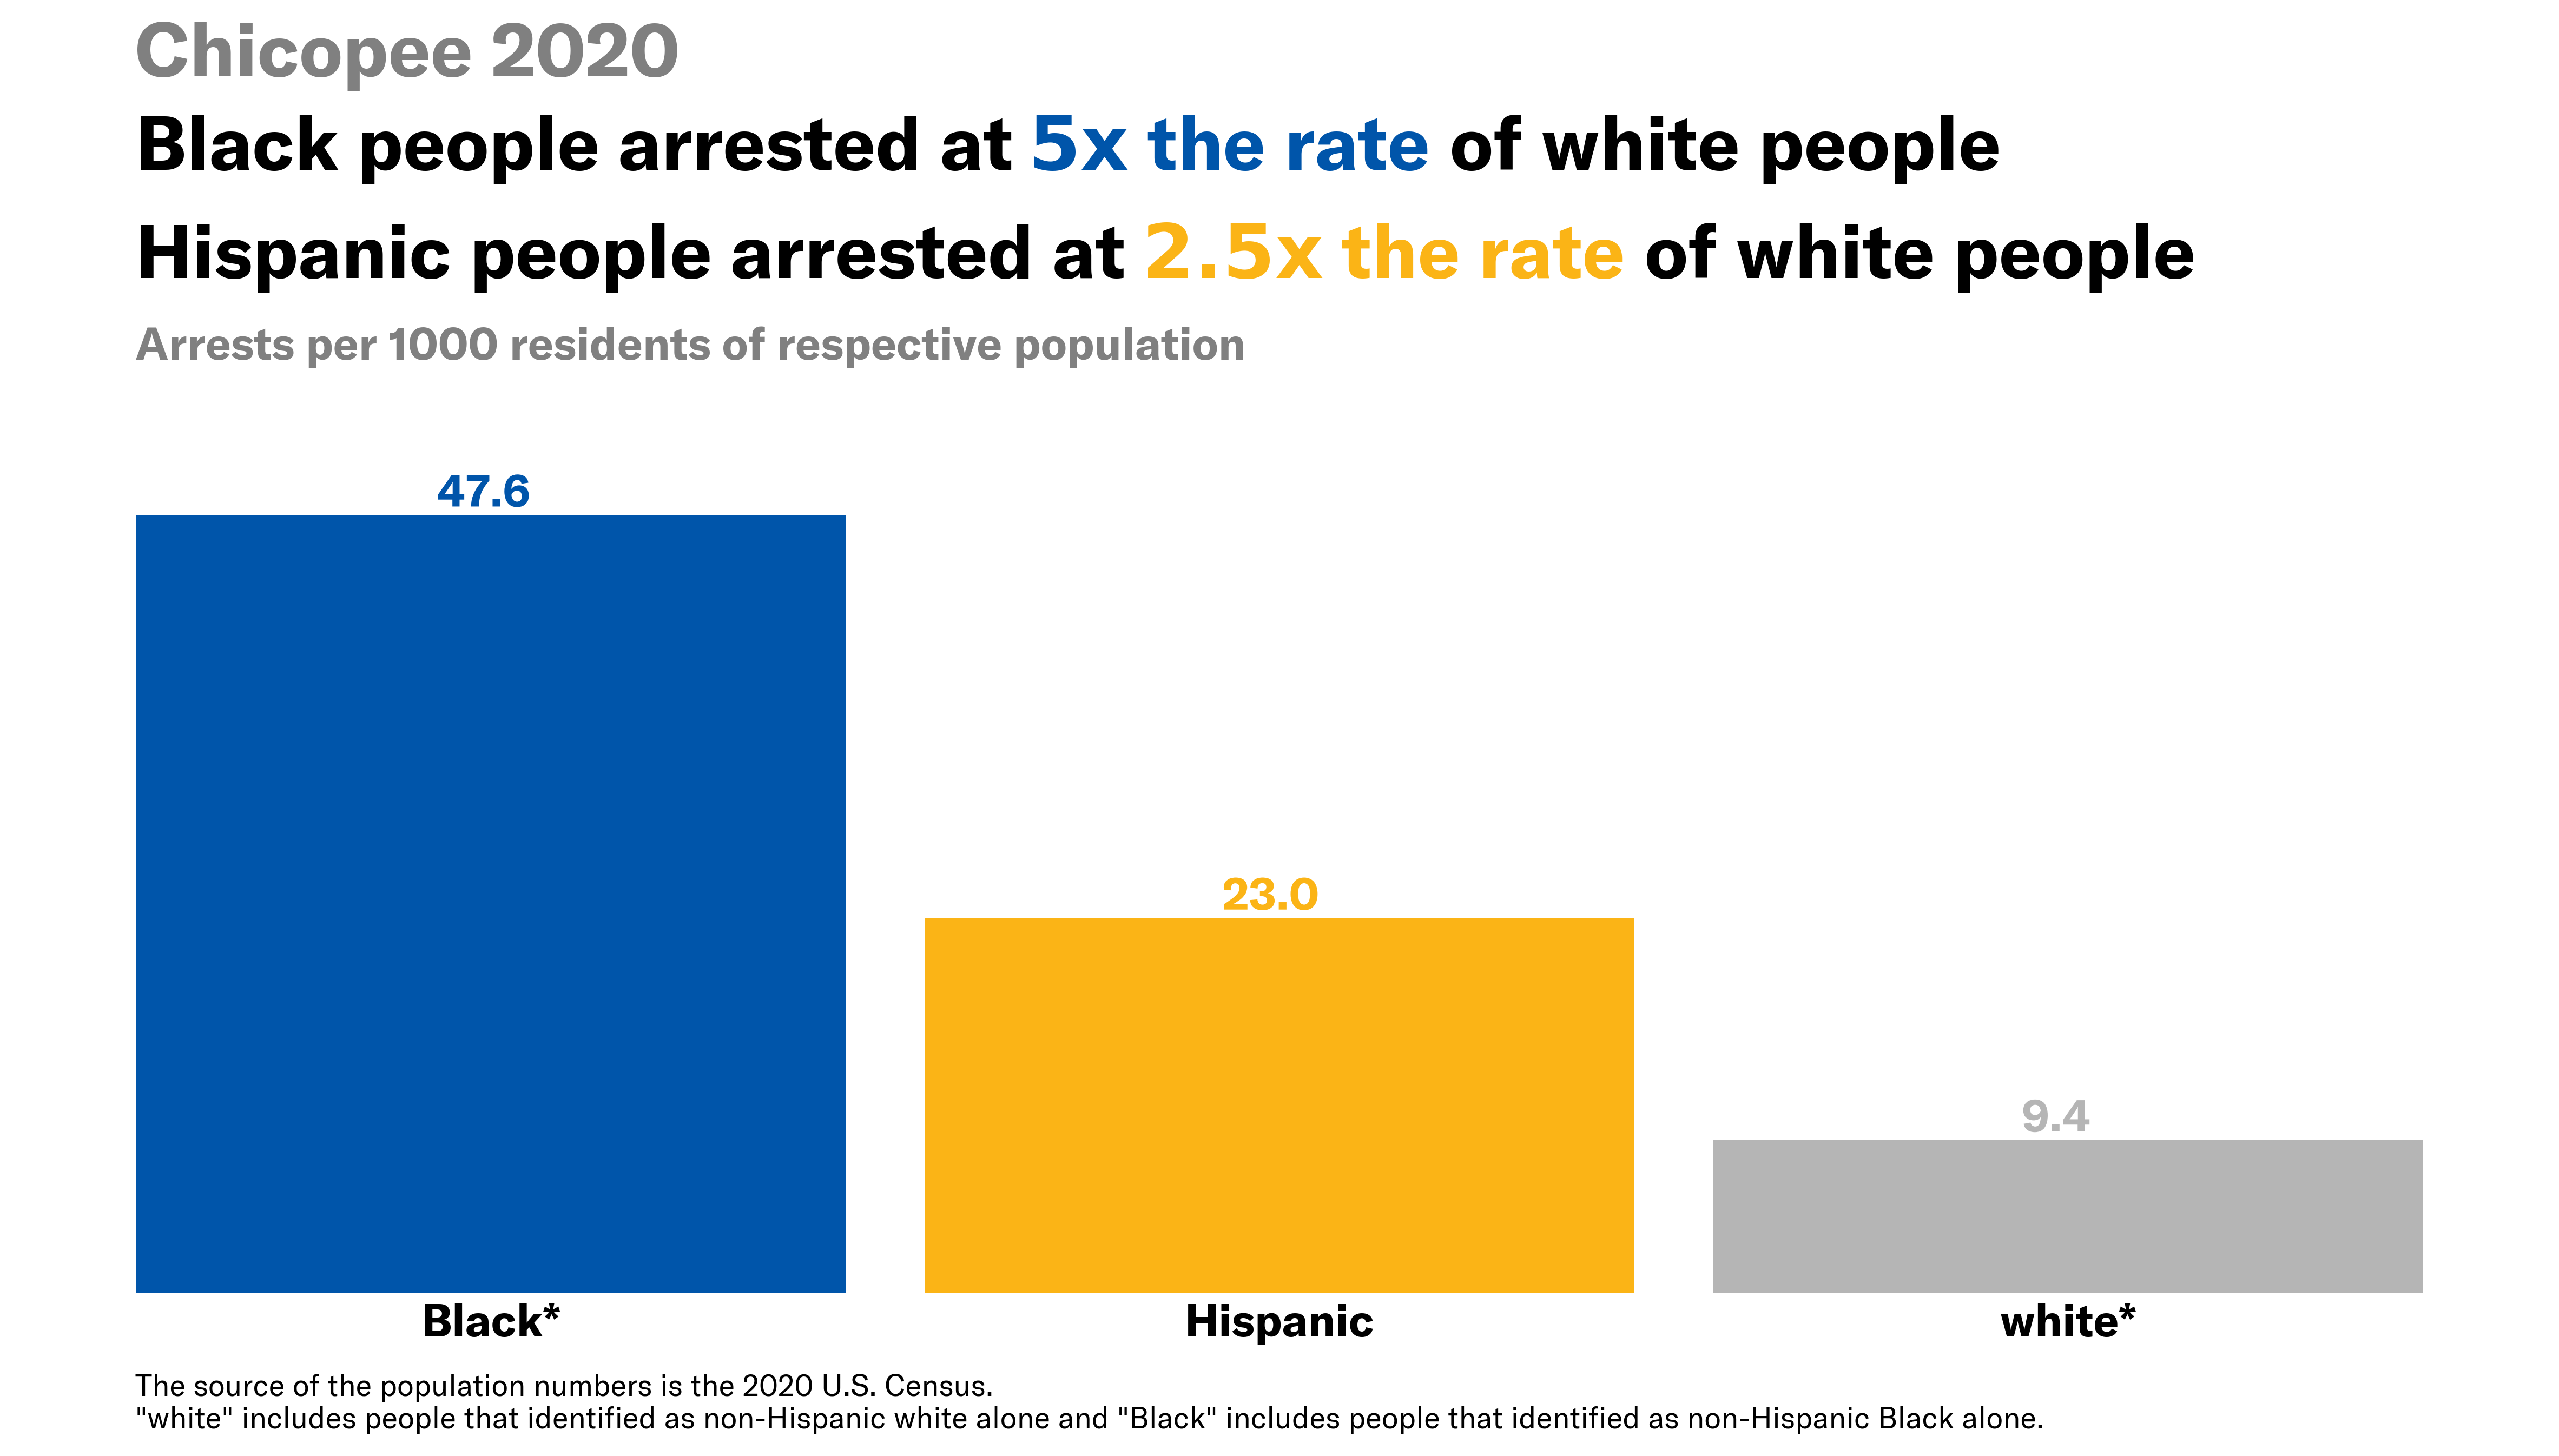
Our analysis suggests there were significant racial disparities in arrest rates across the state in 2020. After a statewide review of the data, our team identified six cities with unusually high rates of arrest and focused on these communities for more in-depth analysis. When compared to the resident population in the six cities analyzed—Fall River, Chicopee, Holyoke, New Bedford, Springfield, and Worcester—Black and Hispanic people were arrested at a much higher rate than white people.
Of these six cities, New Bedford had the highest arrest rate disparity for Black people; Black people were arrested at 5.2x the rate of white people when compared to share of resident population. The disparity for Hispanic people was highest in Chicopee where Hispanic people were arrested at 2.5x the rate of white people. A statewide comparison shows the same concerning pattern. Across the state in 2020, Black people were arrested at 2.9x the rate of white people, and Hispanic people were arrested at 2x the rate of white people.
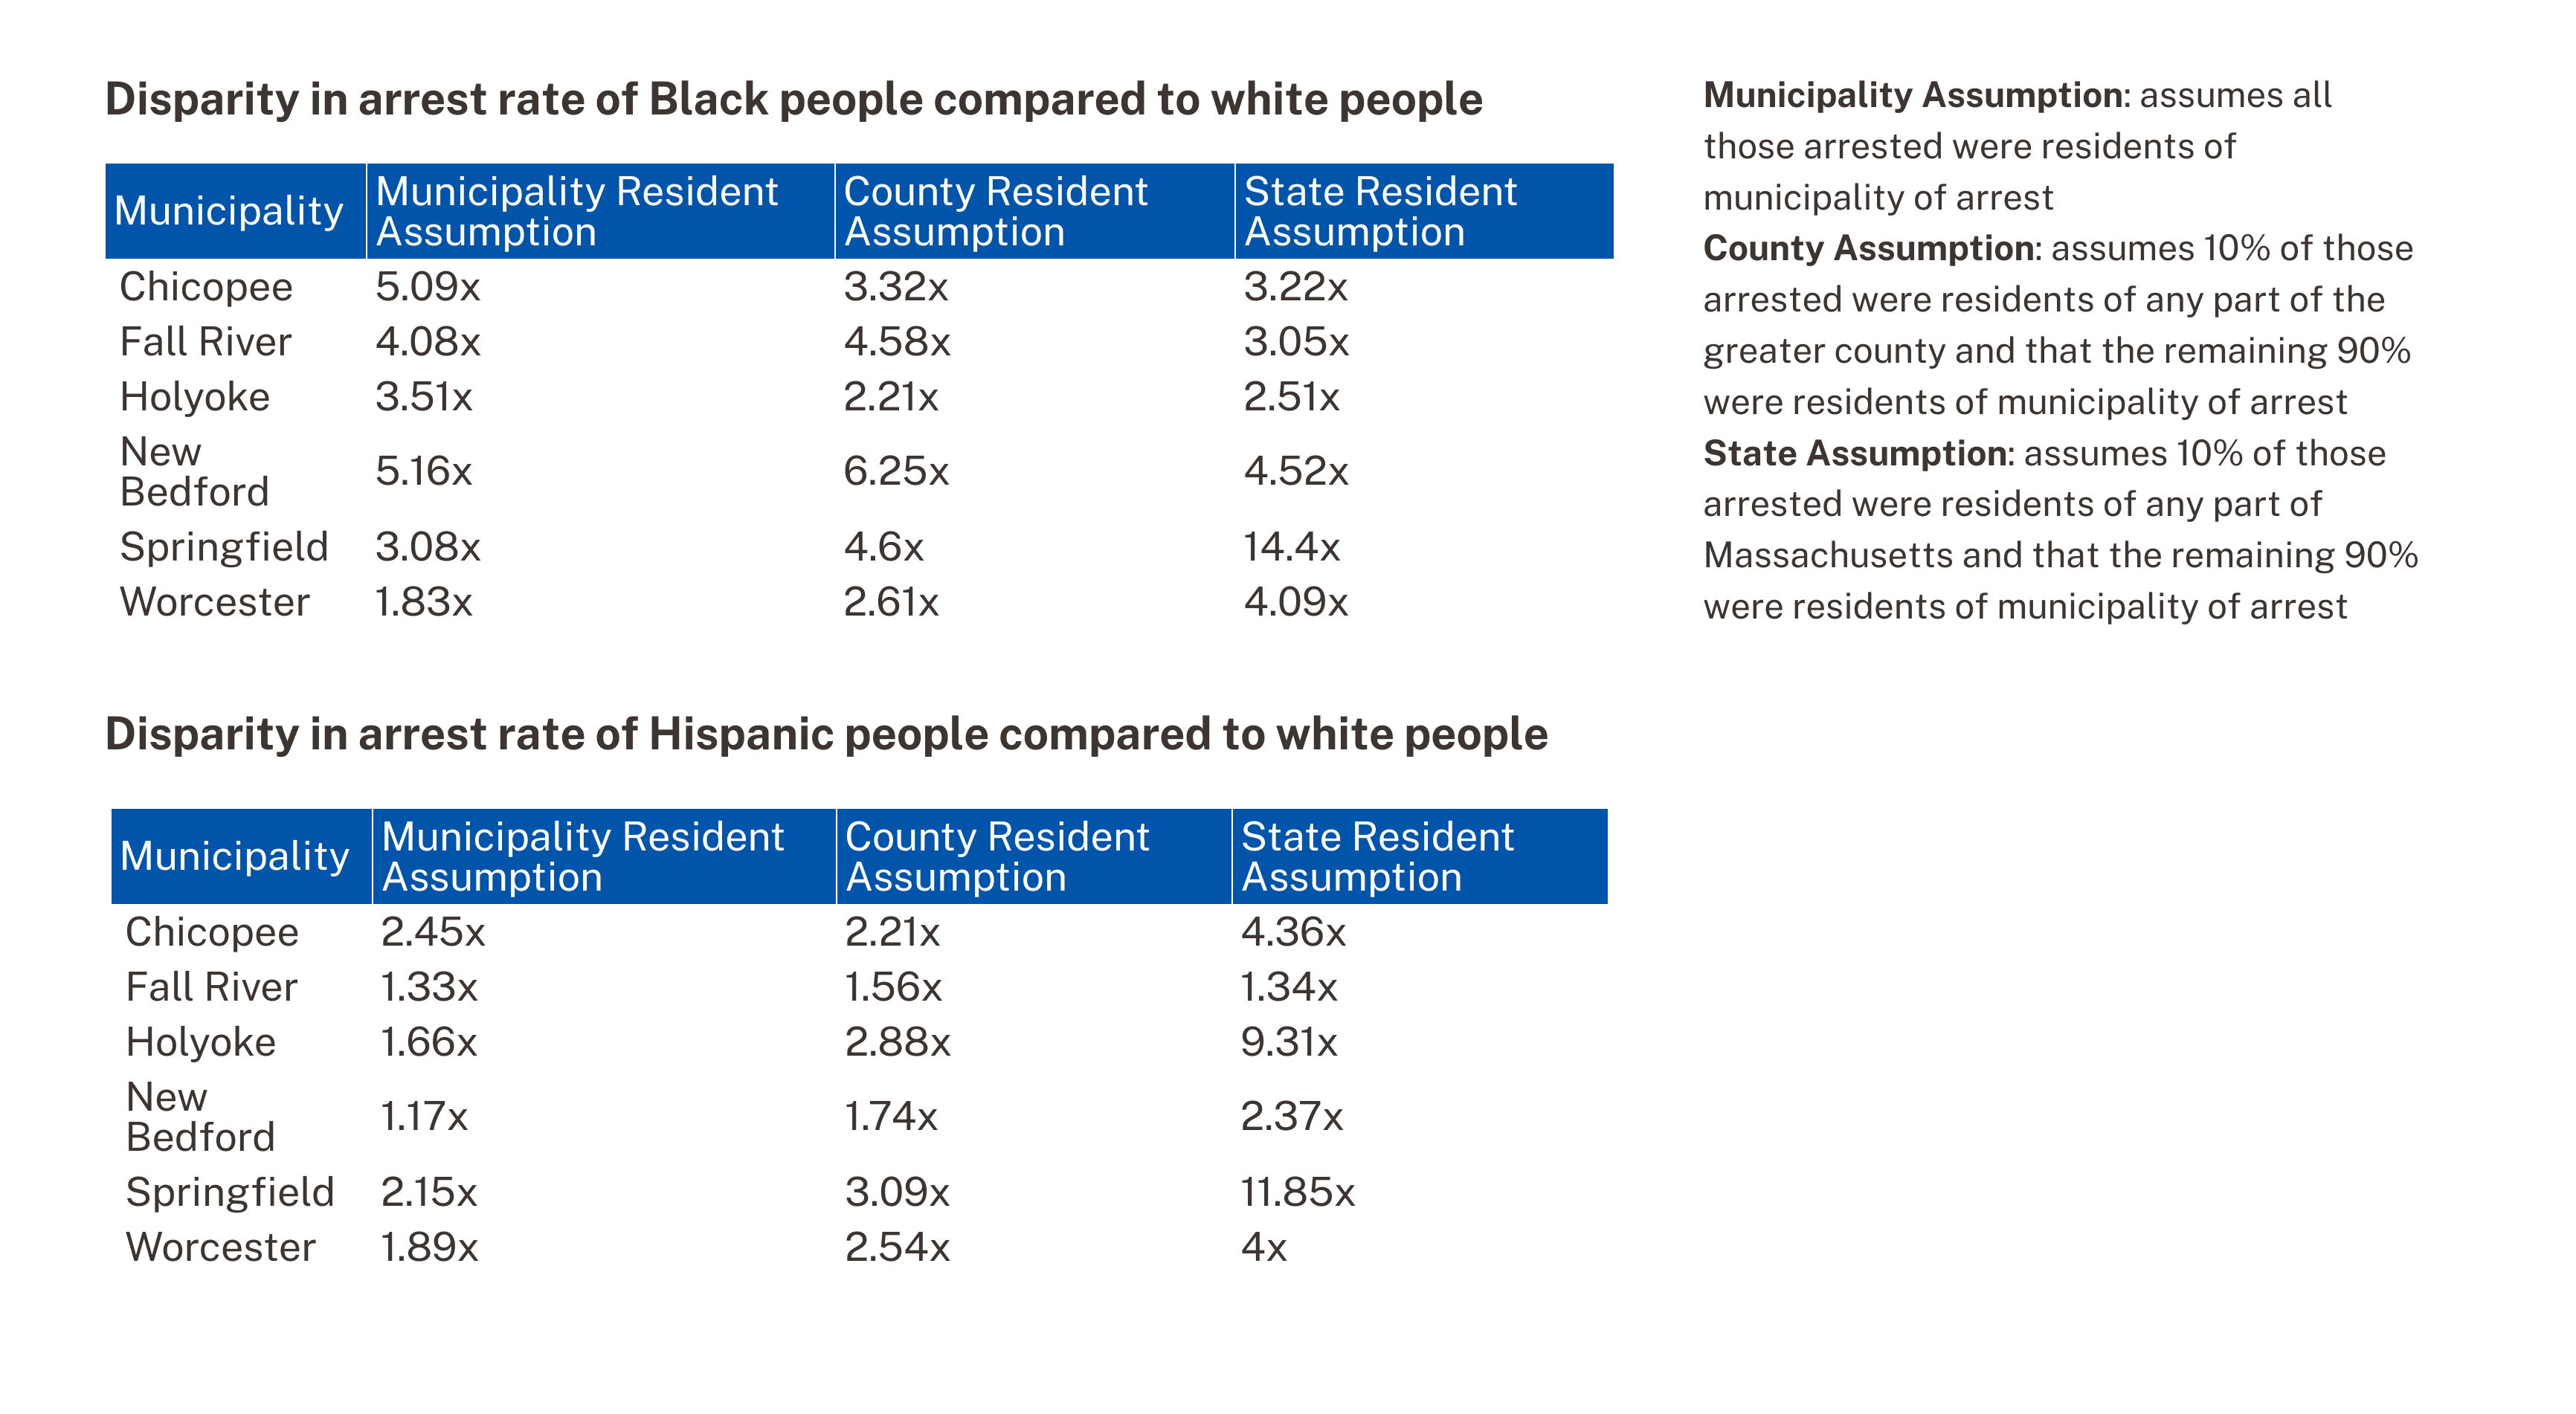
There are some limitations in the data provided by the state. For example, the data do not indicate whether those arrested were residents of the municipality where police made the arrests.1 Nonetheless, comparison of the share of arrests by race to the overall resident population still provides a valuable way to identify potential disparities. Furthermore, the indications of racial disparity are consistent with other reports, such as a 2021 analysis of the same Massachusetts state arrests dataset by NBC10 Boston and students from Boston University’s Justice Media Computational Journalism co-lab. The stark disparities in arrest rates indicated here are considerable and call for continued attention and action.
We can’t manage what we don’t measure. The reporting of arrest data mandated by the 2018 criminal law reform allows us to identify racial disparities in arrests in communities statewide. But analyzing the data is only the first step. Cities and towns need to take a close look at their policies, procedures, and police management to understand why these disparities are occurring, and take corrective action to address them.
Data analysis was conducted by Boston University students including Nikoloz Rapava, Sheila Yee, Natalia Clark, and Xi Li under the supervision of the BU Spark! Program based at the BU Faculty of Computing & Data Sciences and led by Ziba Cranmer (BU) with project management support from Della Lin (Project Manager). This work was done in collaboration with ACLUM.
1 Since the data do not indicate whether or not the arrestee was a resident of the location where they were arrested, the analysis was tested under the case that some portion of arrestees resided in a different part of the state. Even with this modification, Black and Hispanic people were arrested at a much higher rate than white people.
Below is the analysis of arrest rates disparities for Black and Hispanic people assuming 10% of those arrested were residents of any part of the greater county or state.
More of the Same: Unpacking the 2022 Boston Police Budget
Get caught up with last year’s Data for Justice analysis of the BPD budget, and other work around policing in Massachusetts.
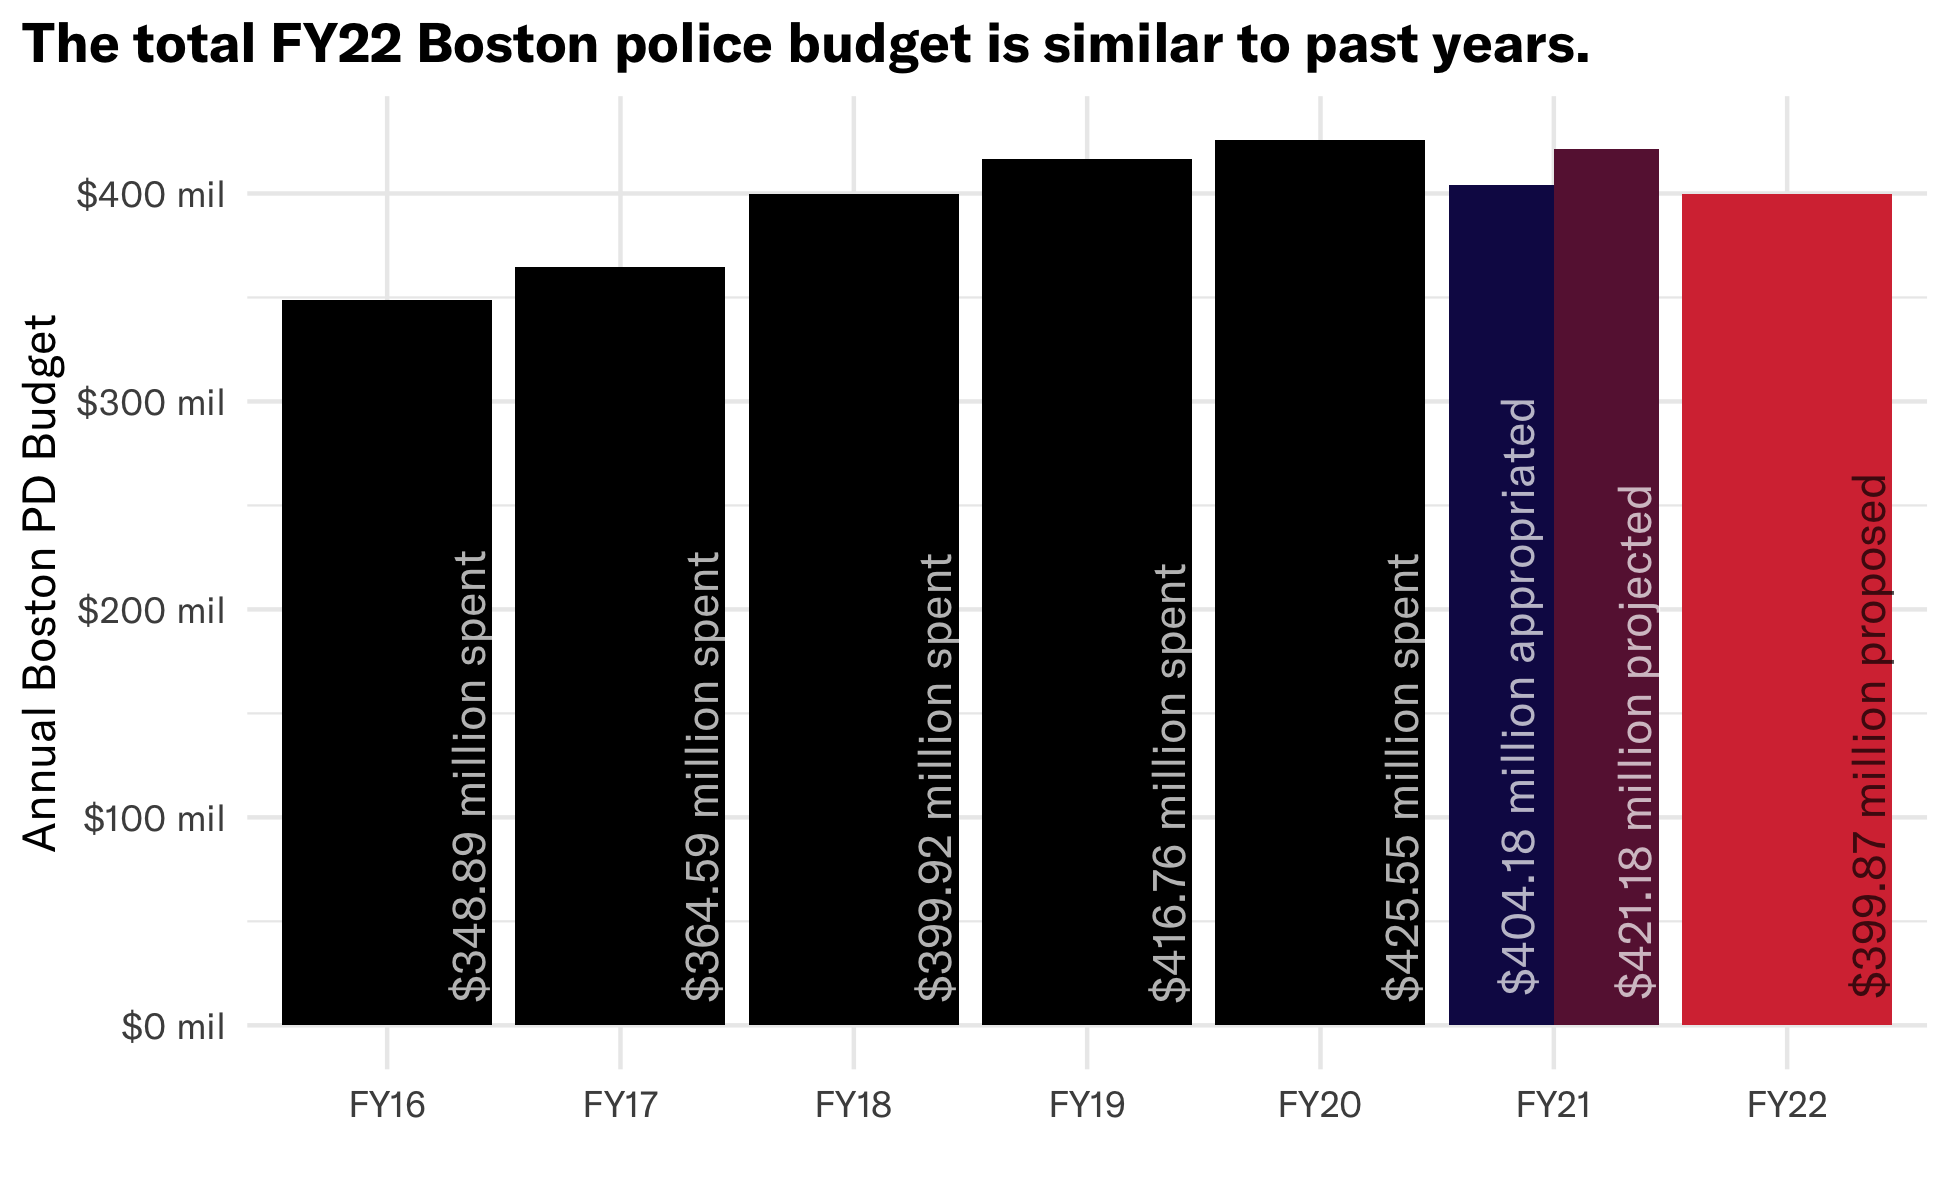
Last month, Boston’s Acting Mayor Kim Janey released her recommended City budget for the upcoming 2022 fiscal year (FY). This budget claims to double down on reducing Boston police overtime, deepening last year’s $12 million budget cut by an additional $4.9 million.
The problem? As recent ACLU analysis shows, without a simultaneous commitment to reining in the power of police unions and penalizing Boston Police Department (BPD) budgetary overages, this “cut” will simply never come to be. Taken together with the fact that Mayor Janey’s recommendation doesn’t really touch the $355 million budgeted for non-overtime policing and otherwise ignores advocates’ calls to divest from police, the FY22 BPD budget is effectively unchanged from years past.
New analysis by the ACLU of Massachusetts unpacks the Boston Police Department budget – again – making it clear that it is effectively no smaller than previous years’ budgets.
The proposed Boston police budget is more of the same.
Numbers show that Mayor Janey’s proposed BPD budget is not a departure from previous BPD budgets. Despite misleading claims around reallocating police overtime, next year’s budget will maintain the status quo in terms of the overall BPD budget, the size of the force, and more.
The BPD budget is still the second-largest line item in the whole city, second only to Boston Public Schools. It is still 1.5x larger than the Cabinet of Administration and Finance (which constitutes 17 individual departments), 9x larger than the Library Department, and 110x larger than the Office of Arts and Culture. The newly-created Office of Police Accountability and Transparency is but a drop in the bucket – for comparison, it’s just over half of the annual BPD clothing allowance ($1.9 million proposed for FY22).
![]()
In FY20, Boston police employees were still paid almost $58,000 more than non-BPD City employees – averaging $132,000 in yearly earnings – and over 500 BPD employees still made more than Boston’s Mayor (519 this time).
![]()
Actually, BPD paychecks swelled even larger. Among the top 20 BPD earners, almost all of them made more in FY20 than they did in FY19:
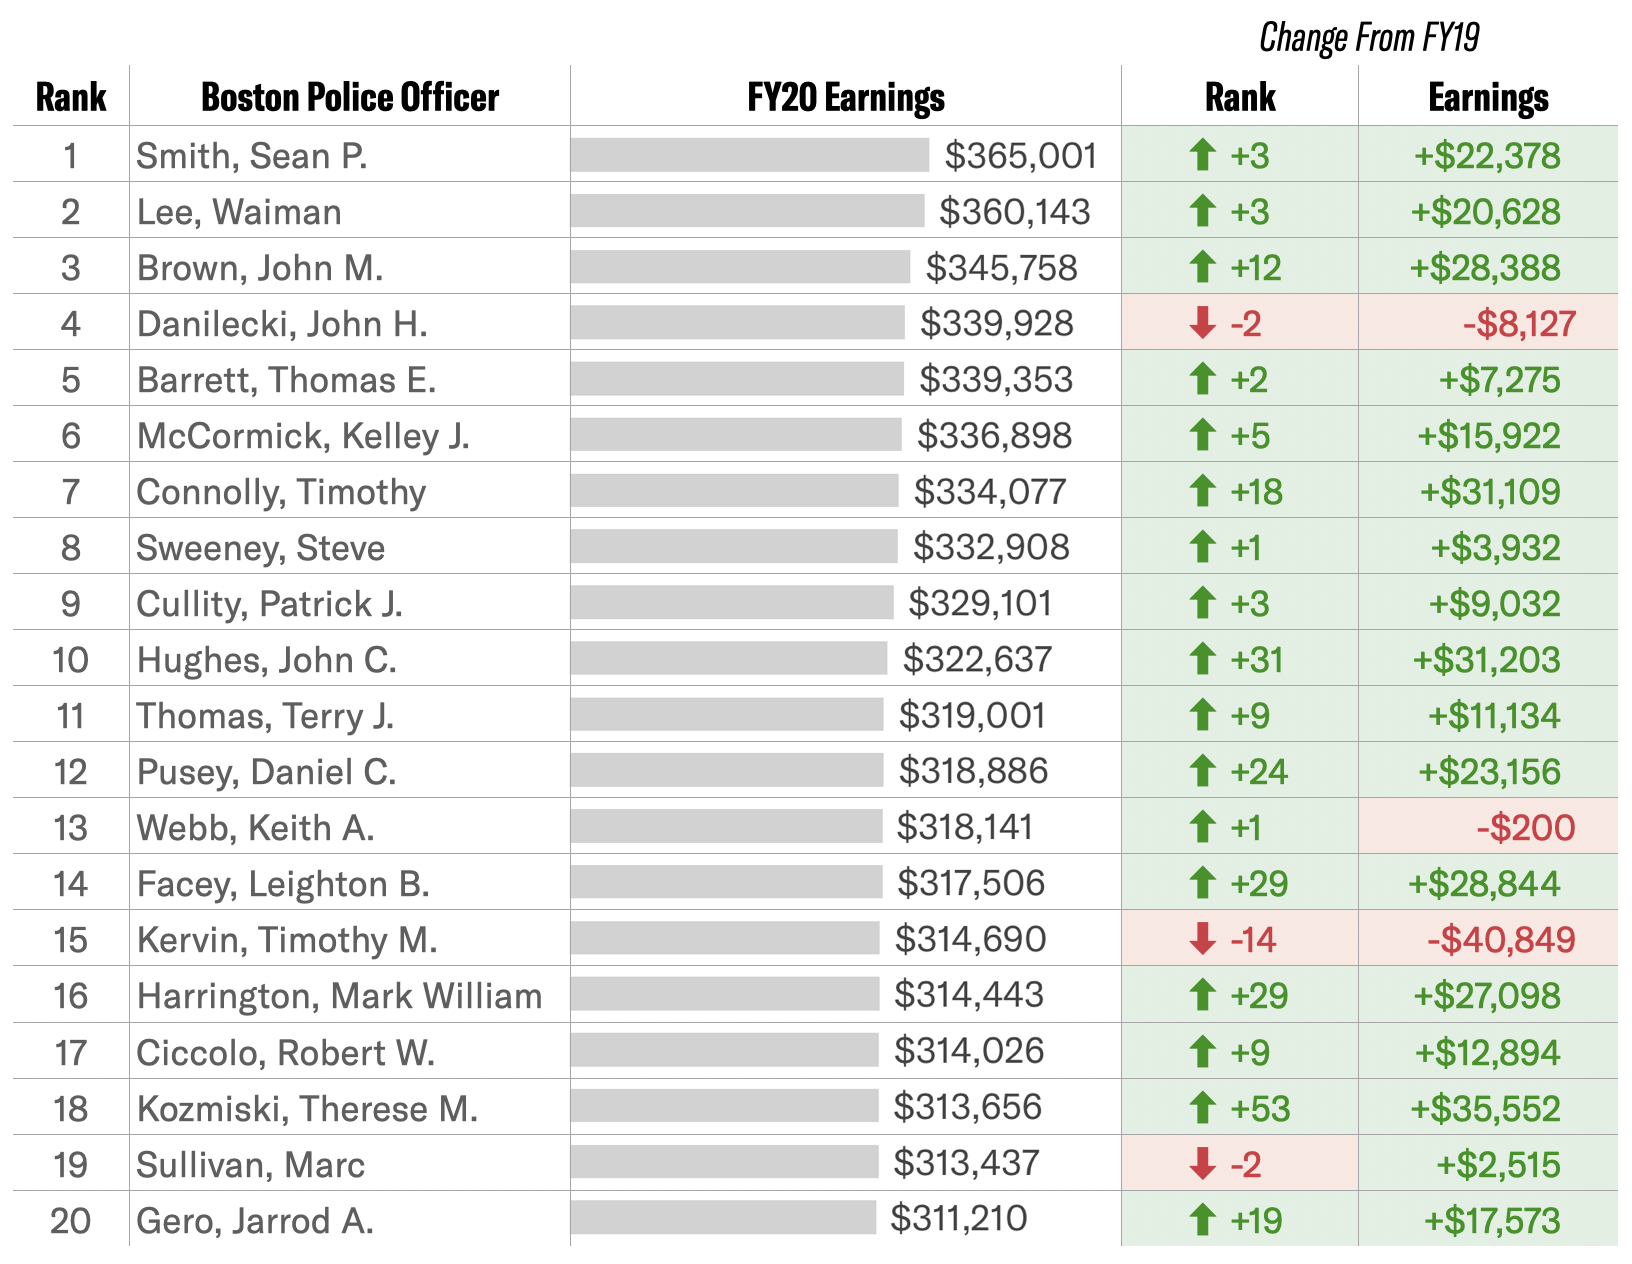
And while the status quo is upheld, the true causes of exorbitant police budgets go unaddressed.
The $22 million “cut” to overtime means… nothing.
Though the mayor’s office is trying to pass it off as a $21.9 million cut, it’s important to note that the BPD overtime budget cut is actually only $4.9 million – from $48.8 million allocated last year to $43.9 million allocated this year. The $22 million figure is not the budgetary difference, but rather the difference from the FY21 projected spending ($65.8 million, according to the BPD).
But, even more fundamentally, it’s critical to debunk a central myth that underlies Mayor Janey’s BPD budget: that the City budget as it stands currently has any power over police overtime spending. Serious contractual and legal changes are needed – largely changes the mayor can make – before any police budget cuts can be meaningful. As laid out in a recent ACLU of Massachusetts analysis, the City’s current interpretation of an exception in the Boston Charter means that the BPD has no guardrails stopping it from grossly overspending.
This blank check comes at a mighty cost: projections of FY21 spending show police overtime is estimated to go $20 million over budget by the end of June.
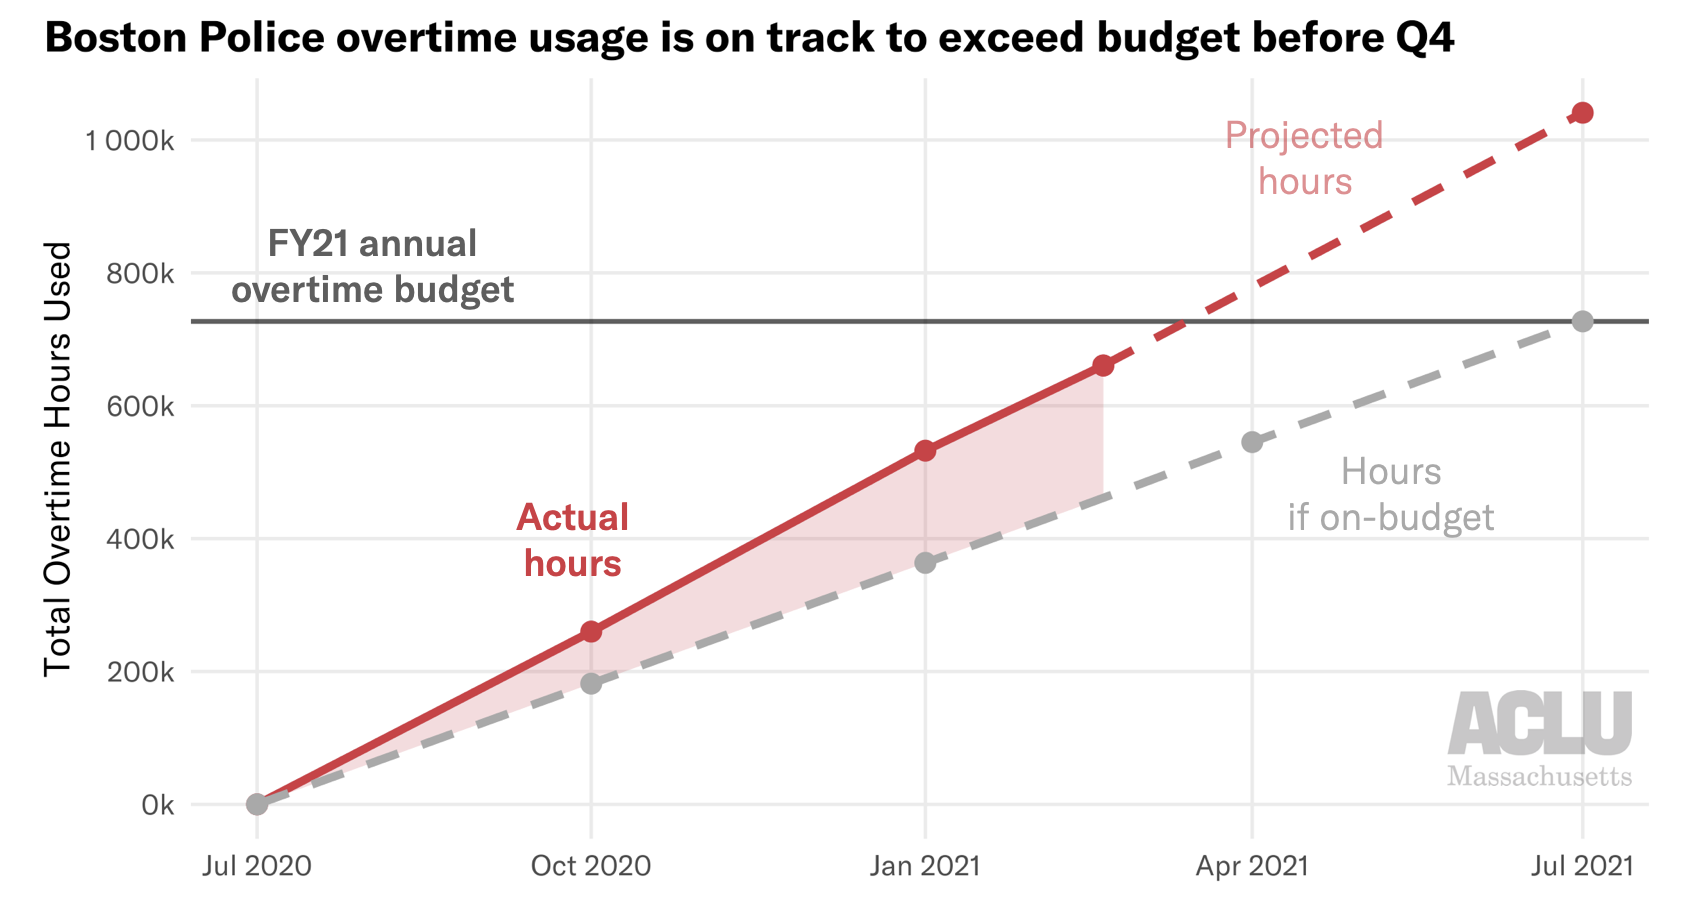
If the BPD couldn’t actualize a $12 million overtime cut during a year when sports stadiums stayed empty and almost all public events were either cancelled or went virtual, why would they be able to actualize a $22 million cut in post-pandemic Boston? It is foolish for the City to expect a different outcome the second time around.
Without taking action that actually changes the system within which the BPD currently operates, the mayoral administration’s rhetoric around reallocating police overtime in next year’s budget is just that: empty rhetoric.
Mayor Janey’s “solution” to overtime will exacerbate the problem.
The Mayor’s recommended budget proposes hiring at least 50 more cops as a means of decreasing overtime spending. This idea is not new among those who would politically benefit from a more powerful police department; Boston City Councilors Ed Flynn and Annissa Essaibi George, as well as the Boston Police Patrolmen’s Association, frequently push to increase the size of the police force. But this solution, too, is based on a myth: that Boston’s police overtime problem is caused by too few police in the ranks. This is untrue; Boston’s police overtime problem is caused by exploitative and unsupervised policing practices that allow the BPD to bleed funds from the City.
Especially when considering the OT problem as a whole – from four hours of pay for 15 minute court appearances, to the Department’s inability to explain the cause of increased injury and sickness even predating COVID-19, to their reluctance to open up administrative positions to civilians, to the secrecy over the minimum staffing level formula – it becomes clear that overtime is not an issue of how many officers are clocking in.
Indeed, historical Boston budget data show that there has been no correlation between a larger police force and lower police overtime spending over the past decade. Some years when the force grew saw higher OT expenditures (e.g., 2014, 2020), and some years when the force shrunk saw lower OT costs (e.g., 2016, 2018). This isn’t surprising: more police lead to more extended tours and more court overtime – and new personnel aren’t necessarily assigned to the units using the most replacement OT.
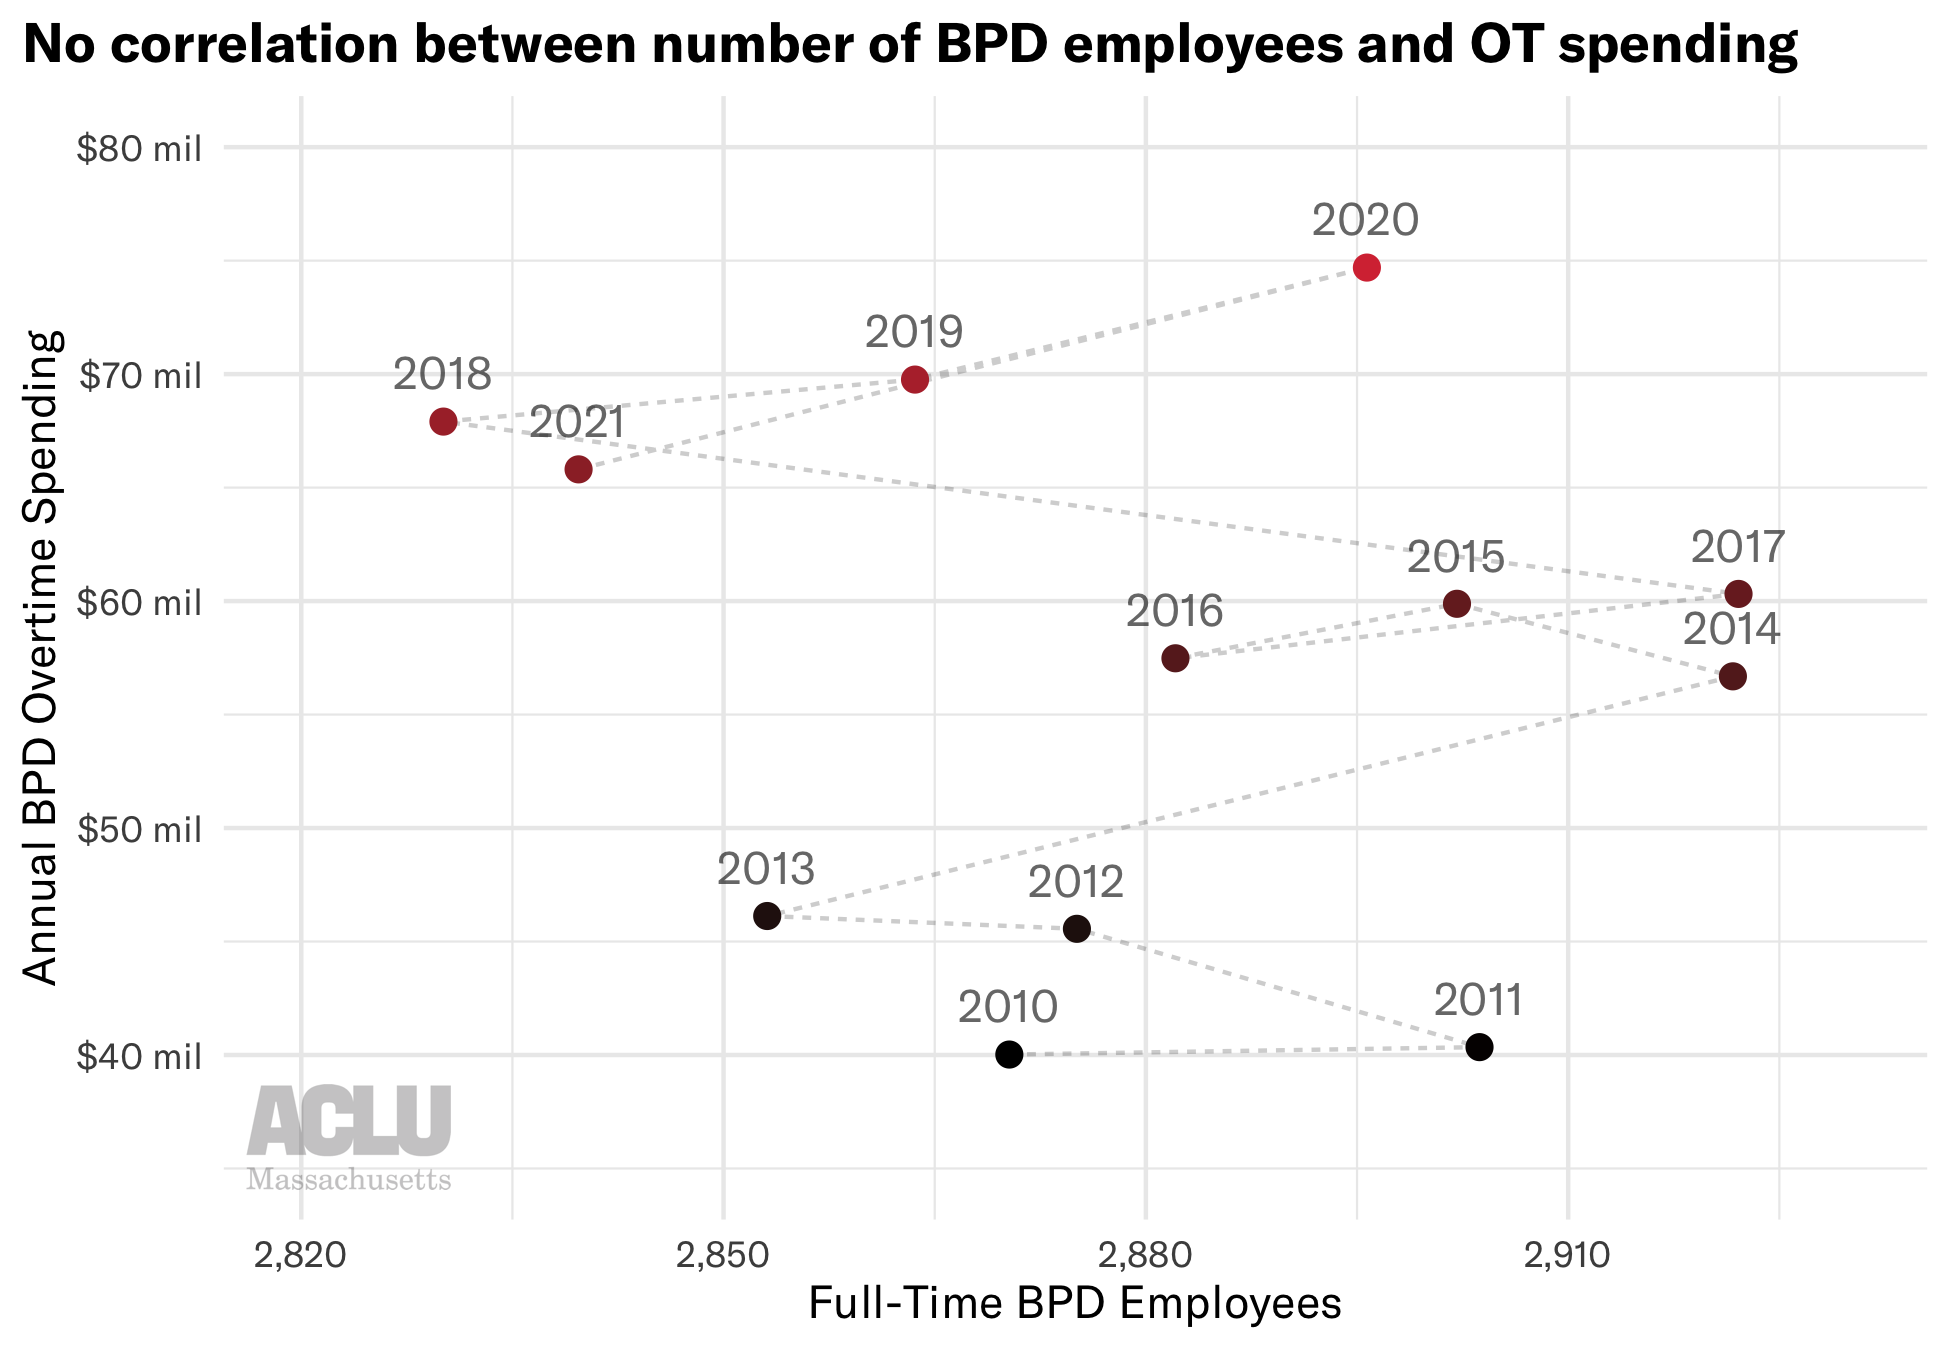
All in all, hiring more officers would do nothing to resolve the BPD’s overtime problem… or to address the remaining hundreds of millions of dollars allocated to the BPD.
Overtime is just the tip of the iceberg.
Critically, Mayor Janey’s focus on cutting only overtime fails to address the whopping $355 million still allocated to the Boston police for non-overtime expenses. She makes no attempt to reduce BRIC funding, cut spending on military equipment, civilianize traffic enforcement, reduce funds for the Youth Violence Strike Force (“gang unit”), or adopt other recommendations urged by community groups.
What’s worse, Mayor Janey’s recommendation wholly ignores the harm that policing already causes to Black and brown communities across Boston, and that community leaders have been protesting for decades. The City’s vague proposal for “alternative policing,” which will work with the BPD, isn’t an acceptable alternative. As the DefundBosCops coalition emphasizes, we need to reroute funds and power into alternative safety initiatives, not just revamped policing. More boots on the ground will solve neither our fiscal dilemma, nor our ongoing local problems with violent and discriminatory policing.
In Boston, police overtime has become smoke and mirrors which distract from more important and urgent policing problems in the City.
Our vision for reinvesting police budgets should not stop at marginal and meaningless budget cuts – and certainly should not include increasing the number of police officers. What we need are new executive priorities that open the door to true budgetary and policy accountability from the police. Only then will efforts to divest from policing and reinvest in community initiatives even be feasible in Boston.
Yet in the shadow of a year of unprecedented international activism around racist police violence and renewed public scrutiny on exorbitant police budgets, the Mayor’s recommended budget shows that Boston taxpayers are about to foot the bill for yet another year of harmful policing.
The mayor’s office must systematically transform the nature of police funding in Boston by committing to strong reforms in police union contracts, and by explicitly adopting a more conservative interpretation of the overspending exception in the City Charter. Last year, then-Councilor Kim Janey called upon the Mayor to cut the BPD budget by 10 percent; this year, she has the power to that, and more, herself.
Additionally, the Boston City Council must reject Mayor Janey’s recommended budget, instead pushing for a budget that actually divests from police spending beyond just overtime, rejects any new police hires, and truly reinvests in community initiatives.
When it comes to police spending in Boston, we can no longer accept more of the same.
What to do about it:
- Boston residents: Take and share the Boston People’s Budget survey to voice your priorities for where taxpayer dollars should go in the City of Boston
- Follow Muslim Justice League and watch #DefundBosCops on Twitter and Instagram
- Email and call Mayor Kim Janey and the Boston City Council to vocalize your support for smaller police budgets, transparency around police contract negotiations, and consequences for police overspending.
- Sign up to testify at Boston City Council hearings on the budget to urge the Council to reject the proposed BPD budget:
- Monday, May 10, 2021, 2 PM ET: Hearing on the Boston Police Department
- Wednesday, May 26, 2021, 3 PM ET: Carryover Hearing on the Boston Police Department
- Thursday, June 3, 2021, 6 PM ET: Dedicated Public Testimony
Where do these data come from?
- Boston City Council documents
- Data on BPD OT usage presented at March 12 Boston City Council hearing
- Boston City budget website
- Overview of proposed citywide FY22 operating budget
- Boston public safety cabinet (including the office of emergency management, fire department, and police department) adopted FY07-21 and proposed FY22 budget, including line items by accounts payable, and list of department personnel & salaries
- Boston’s open data portal
- Proposed and adopted operating budgets from 2020 and 2021, broken down by cabinet, department, and program
- City of Boston 2020 employee earnings report
This analysis benefitted from feedback and input from members of the Muslim Justice League, the Youth Justice and Power Union, and the Building Up People Not Prisons Coalition.
A Mayor’s Roadmap to Curb Boston Police Overtime
New to Data for Justice? Get caught up with our 2020 report on the Boston Police budget and other work on policing in Massachusetts.
Boston’s Acting Mayor Kim Janey just this week proposed a new budget for the coming fiscal year: one which maintains a slightly reduced allocation for police overtime. But as we look to the future of policing budgets, we still have much to learn from the past.
Last June, facing monumental pressure from local advocates and community members, the Boston City Council approved a City budget that “cut” the Boston Police Department’s gargantuan overtime allowance by 20 percent – from $60 million to $48 million. Not even a year later, that “cut” has been exposed as an empty promise.
On March 12, the Boston City council held its third quarterly hearing to follow up on how the BPD is reducing overtime costs. The update was bleak: just eight months into fiscal year 2021 (FY21), data show the BPD has already blown through almost the entirety of its $48 million overtime budget – setting itself up to finish out the fiscal year $20 million over budget.
This debacle has made one thing quite clear: when it comes to reining in police spending in Boston, the budget as defined by the City Council is effectively irrelevant. This is due to both (1) a century-old exception in the City Charter that writes the Police Department a blank check, and (2) the fact that many aspects of policing policy are tied up within police union contracts. So who is it that holds the power to actually affect change? TL;DR: it’s the mayor.
In a new analysis, the ACLU of Massachusetts dives deeper into the issue of overtime within the Boston Police Department and how the Mayor of Boston might be able to finally address it. We set out to answer the following questions:
- Just how big is the BPD’s FY21 overtime overage?
- Why does the City let police overtime spending go over budget at all?
- What factors contribute to overtime spending?
- How can we actually fix it?
Access and share this blog published in the form of a report here.
Just how big is the BPD’s FY21 overtime overage?
Since we are only three quarters of the way through FY21 (the fiscal year in Boston goes from July 1 through June 30), we can’t know how much the BPD will ultimately go over their overtime budget. However, current projections show an extreme overage, to the tune of more than 300,000 hours.

Indeed, if the current rate of overtime usage continues through the end of FY21, BPD will close out the year with a whopping 1 million overtime hours – 30 percent above the budgeted 727,000 hours. With an hourly overtime rate of approximately 66 dollars an hour, that overage translates to about $20 million of unbudgeted spending that the City will have to cough up. (The BPD itself predicts an overage of $15 million, but that would require a decrease in the rate of OT usage over the next three months – an unlikely outcome.)
It’s hard to overstate how far these taxpayer dollars could go if they were put elsewhere. The projected $20 million excess is about half of the FY21 budget for the Library Department and is 8 times larger than the entire FY21 budget for the Office of Health & Human Services. Actually, the projected $20 million excess is larger than the FY21 budgets of the following 10 City departments combined:
- Veterans’ Engagement ($4.6 million)
- Neighborhood Services ($4.1 million)
- Environment ($3.2 million)
- Health & Human Services ($2.4 million)
- Arts & Culture ($2.2 million)
- Immigrant Advancement ($1.1 million)
- Human Rights ($500,000)
- Women’s Advancement ($460,000)
- Fair Housing & Equity ($320,000)
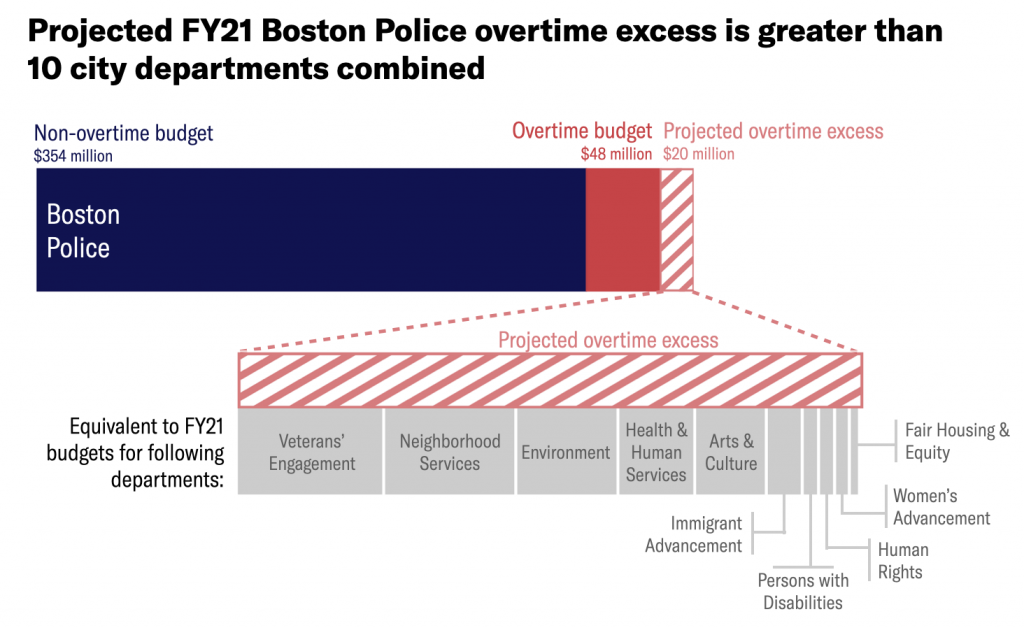
These numbers make it clear that the Boston Police Department is a budgetary parasite, aggressively hoarding taxpayer funds that are sorely needed by other City offices that provide support to communities.
So, how is it that the police are allowed to go over their budget so egregiously?
Why does the City let police overtime spending go over budget at all?
Historically, the Police Department has seen by far the largest overtime overages of any City department. In FY19, for instance, overtime spending went $10.4 million over budget. No other department came close:
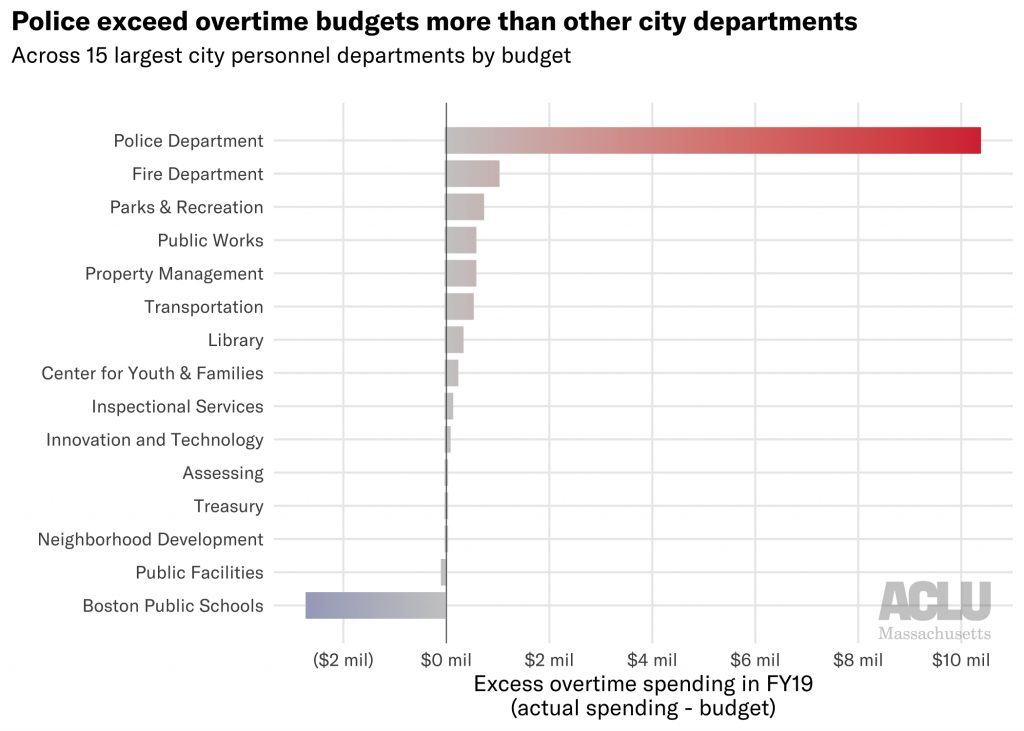
And in comparison, the largest City department, Boston Public Schools, actually spent $2.7 million less on overtime than they were budgeted in FY19.
The City allows police overtime overages to happen because of a vague exception carved out of the City Charter, first included in 1909 and later amended in 1982. It states:
No official of said city, except in case of extreme emergency involving the health or safety of the people or their property, shall expend intentionally in any fiscal year any sum in excess of the appropriations duly made in accordance with law (Boston City Charter, section 42, emphasis added)
In practice this clause is interpreted by the City to mean, as stated by the Boston Municipal Research Board in their 2014 report, that “Police and Fire Department spending for emergency situations, snow removal costs and Execution of Court expenses from court decisions are legally allowed to exceed their appropriations.” No matter that Section 42 does not explicitly mention the Police Department.
Curiously, the above language could suggest that City offices which address public health crises, including COVID-19 and systemic racism, are also allowed to spend in excess of their budgets – but this is not how the Charter has historically been interpreted.
Effectively, the City has decided that all policing qualifies as an “extreme emergency,” and as such is not beholden to budgetary appropriations; police can use City funds with wild abandon without the fear of consequence that other departments face.
What factors contribute to overtime spending?
So where are all of these unfettered overtime funds going? Boston Police officers use various different sorts of overtime:
- Extended tours – when officers work longer than their assigned 8-hour shift
- Additional tours/call out – when officers are called in for unexpected additional shifts
- Court – when BPD officers visit a courthouse (dropping off documents, testifying, etc.) outside of their normal shift; results in a minimum 4 hours of overtime pay regardless of visit length
- Special events –when BPD officers establish a presence at specific events (e.g., parades, sporting events, elections) or certain situations (e.g. heavy police presence at Mass & Cass)
- Replacement – when officers sign up for extras shifts to cover officers who are out on sick leave, vacation, etc.
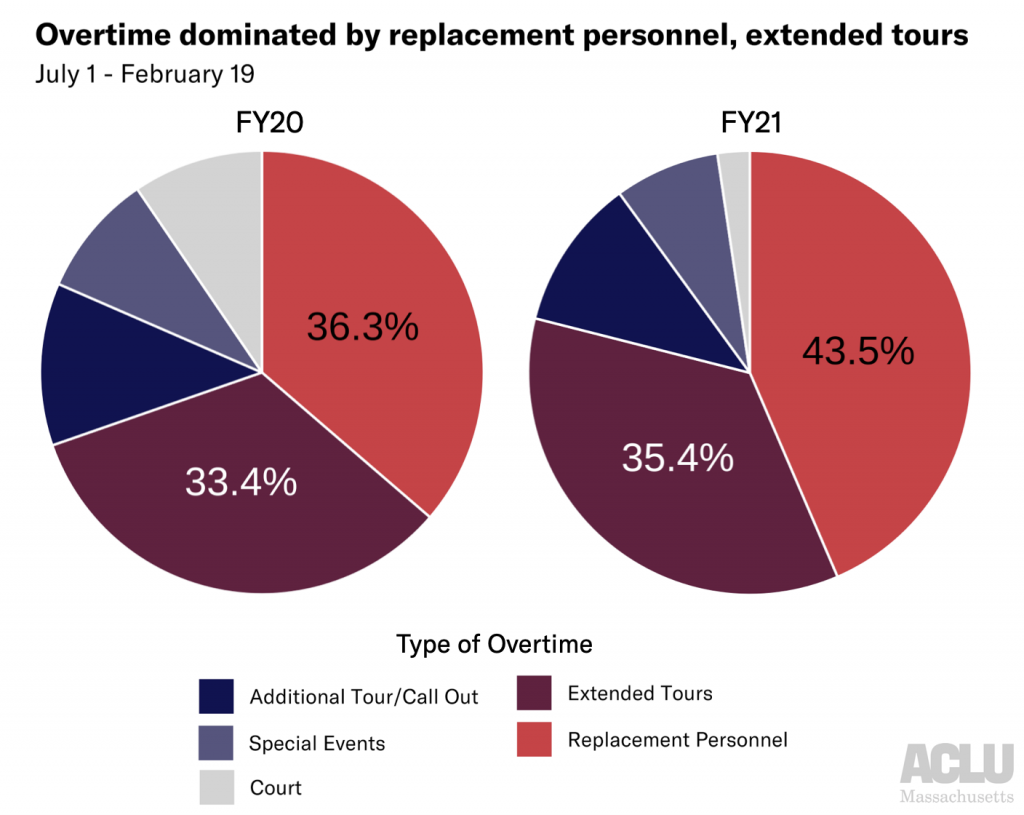
Replacing personnel and extending tours account for the vast majority of overtime hours – over 75 percent so far in FY21. It’s hard to know exactly why this is, as the police have provided multiple reasons including more officers out on sick leave due to COVID, an increase in retirements, and precautions taken around the 2020 election.
But different categories beg the fundamental question: what counts as “overtime”? Why aren’t officers’ schedules arranged such that court visits, annual parades, and longer shifts are included within normal shift scheduling, avoiding costly time-and-a-half overtime pay? Could it be the case that the “minimum staffing” standards that the Department establishes are inflated, requiring more officers than necessary to be on the street, and thus requiring more costly replacement personnel overtime than reasonably required? The BPD has sidestepped questions by the City Council about just these issues.
It's also critical to ask how overtime policing specifically causes harm. Police presence at “special events” has resulted in the cops destroying wheelchairs, running over peaceful protestors (and later bragging about it on camera), and displacing poor and unhoused residents. As long as the City excuses such destructive behavior from the BPD, the cost of police overtime will always be more than just financial.
Careful consideration of such questions helps underscore that the solution to the overtime problem is not hiring more police officers. We aren’t in this overtime mess because Boston has too few cops; we’re in this mess because of toothless budgetary policies, decades of unsupervised policing practices, and an unrestricted power that police wield over their role in the City.
How can we actually fix it?
As the past eight months have exemplified, thanks to the carve-out in the City Charter, any police budget cuts approved by the City Council have no teeth. In addition, many of the policing-related ordinances that the Council is considering this session would be effectively powerless even if passed, because the policies they seek to change are concretized in police union contracts – such as policies defining shift scheduling, discipline, court overtime, 9-1-1 dispatch, and construction details.
Rather than the Council, the governmental body which currently has the power to actualize police budget reform is the Mayor. Specifically, the current budget can be changed based on (1) the Mayor’s priorities while renegotiating police association contracts, and (2) their interpretation of exceptions for police spending written into the City Charter.
We expect that many of the City’s largest police fraternities are now in the process of renegotiating their collective bargaining agreements after their expiration on June 30, 2020, including the Boston Police Patrolmen Association and the Boston Police Detectives Benevolent Society. (There is no way to know the status of new contracts because police association negotiations are not open to the public.) As demonstrated by their statements and actions, police fraternities are neither aligned with the broader labor movement nor are they concerned with public safety; their overreaching power must be reined in.
As such, Boston’s mayor must negotiate contracts that establish reasonable salaries and free up more aspects of policing policy to be under City, not police fraternity, control. Even better, the mayor should lift the veil of secrecy around such an important process: soliciting input from community leaders and advocates when determining priorities and lines in the sand for fraternity contracts, and clearly communicating those priorities to the public. Only then might the City Council pass progressive policing policies that have a shot at actually affecting change.
Additionally, there is reason to believe that of what constitutes an “extreme emergency” as stated in the City Charter might go far to re-establish accountability structures when the police, say, go seven figures over their allocated budget. The police will likely claim that everything they do qualifies as an “emergency,” but the City doesn’t have to agree. Modern policing in Boston includes much more than 9-1-1 dispatch and urgent responses to local events; overtime policing is not emergency response.
Excessive police spending in Boston is a budgetary octopus: there are many different arms thrashing about that contribute to the problem. Between disproportionate payroll increases resulting from extremely powerful police fraternities (i.e. arbitration awards), overly generous court appearance policies that pay police for time they don’t work, monopolization of private construction details, potential misuse of sick leave policies, and costly vacation buyback programs that boost pensions, it can be hard to know where to start.
When it comes to police overtime, the past year has been a long lesson in the danger of symbolic “changes” that ultimately leave the status quo untouched. Yet local advocacy groups like Muslim Justice League and Families for Justice as Healing have not quieted their calls to redistribute police funding back into communities. Their continuing pressure for more transparency has helped to illuminate the path forward.
We know what the next steps are: Acting Mayor Kim Janey, and every mayoral administration to come, must take a strong stance against egregious police spending: refusing to agree to exploitative police union contracts and putting a foot down over “emergency” budget excesses.
Data sources:
- Data on BPD OT usage presented at March 12 Boston City Council hearing
- Documents reporting Boston FY19 departmental OT budgets (listed in FY20 documents) and OT expenditures (listed in FY21 documents)
- Adopted Boston FY21 budget
This report and analysis was authored by Lauren Chambers (ACLUM) with the guidance of Kade Crockford and Rahsaan Hall (ACLUM) . The analysis also benefitted from crucial feedback and input from members of the Muslim Justice League and the Building Up People Not Prisons Coalition.
Clearview, Cameras, and Karen: Newly Released Documents Expose Facial Recognition Technologies Used Across Massachusetts
Today, the ACLU of Massachusetts published a repository of over 1,400 documents which paint a picture of how government agencies across Massachusetts have been using facial recognition technology in recent years. The repository catalogs the breadth of contexts in which the Massachusetts government has flirted with facial recognition, a dystopian technology that is dangerously inaccurate when used on faces with darker skin, feminine features, younger features, or older features.
These documents are the result of over 400 individual public records requests filed predominantly between 2018 and 2020. They chronicle facial recognition surveillance technologies being marketed to and used in state agencies, municipal police departments and schools, and they include hundreds of solicitations from tech companies aggressively marketing their products to a wide range of government agencies.
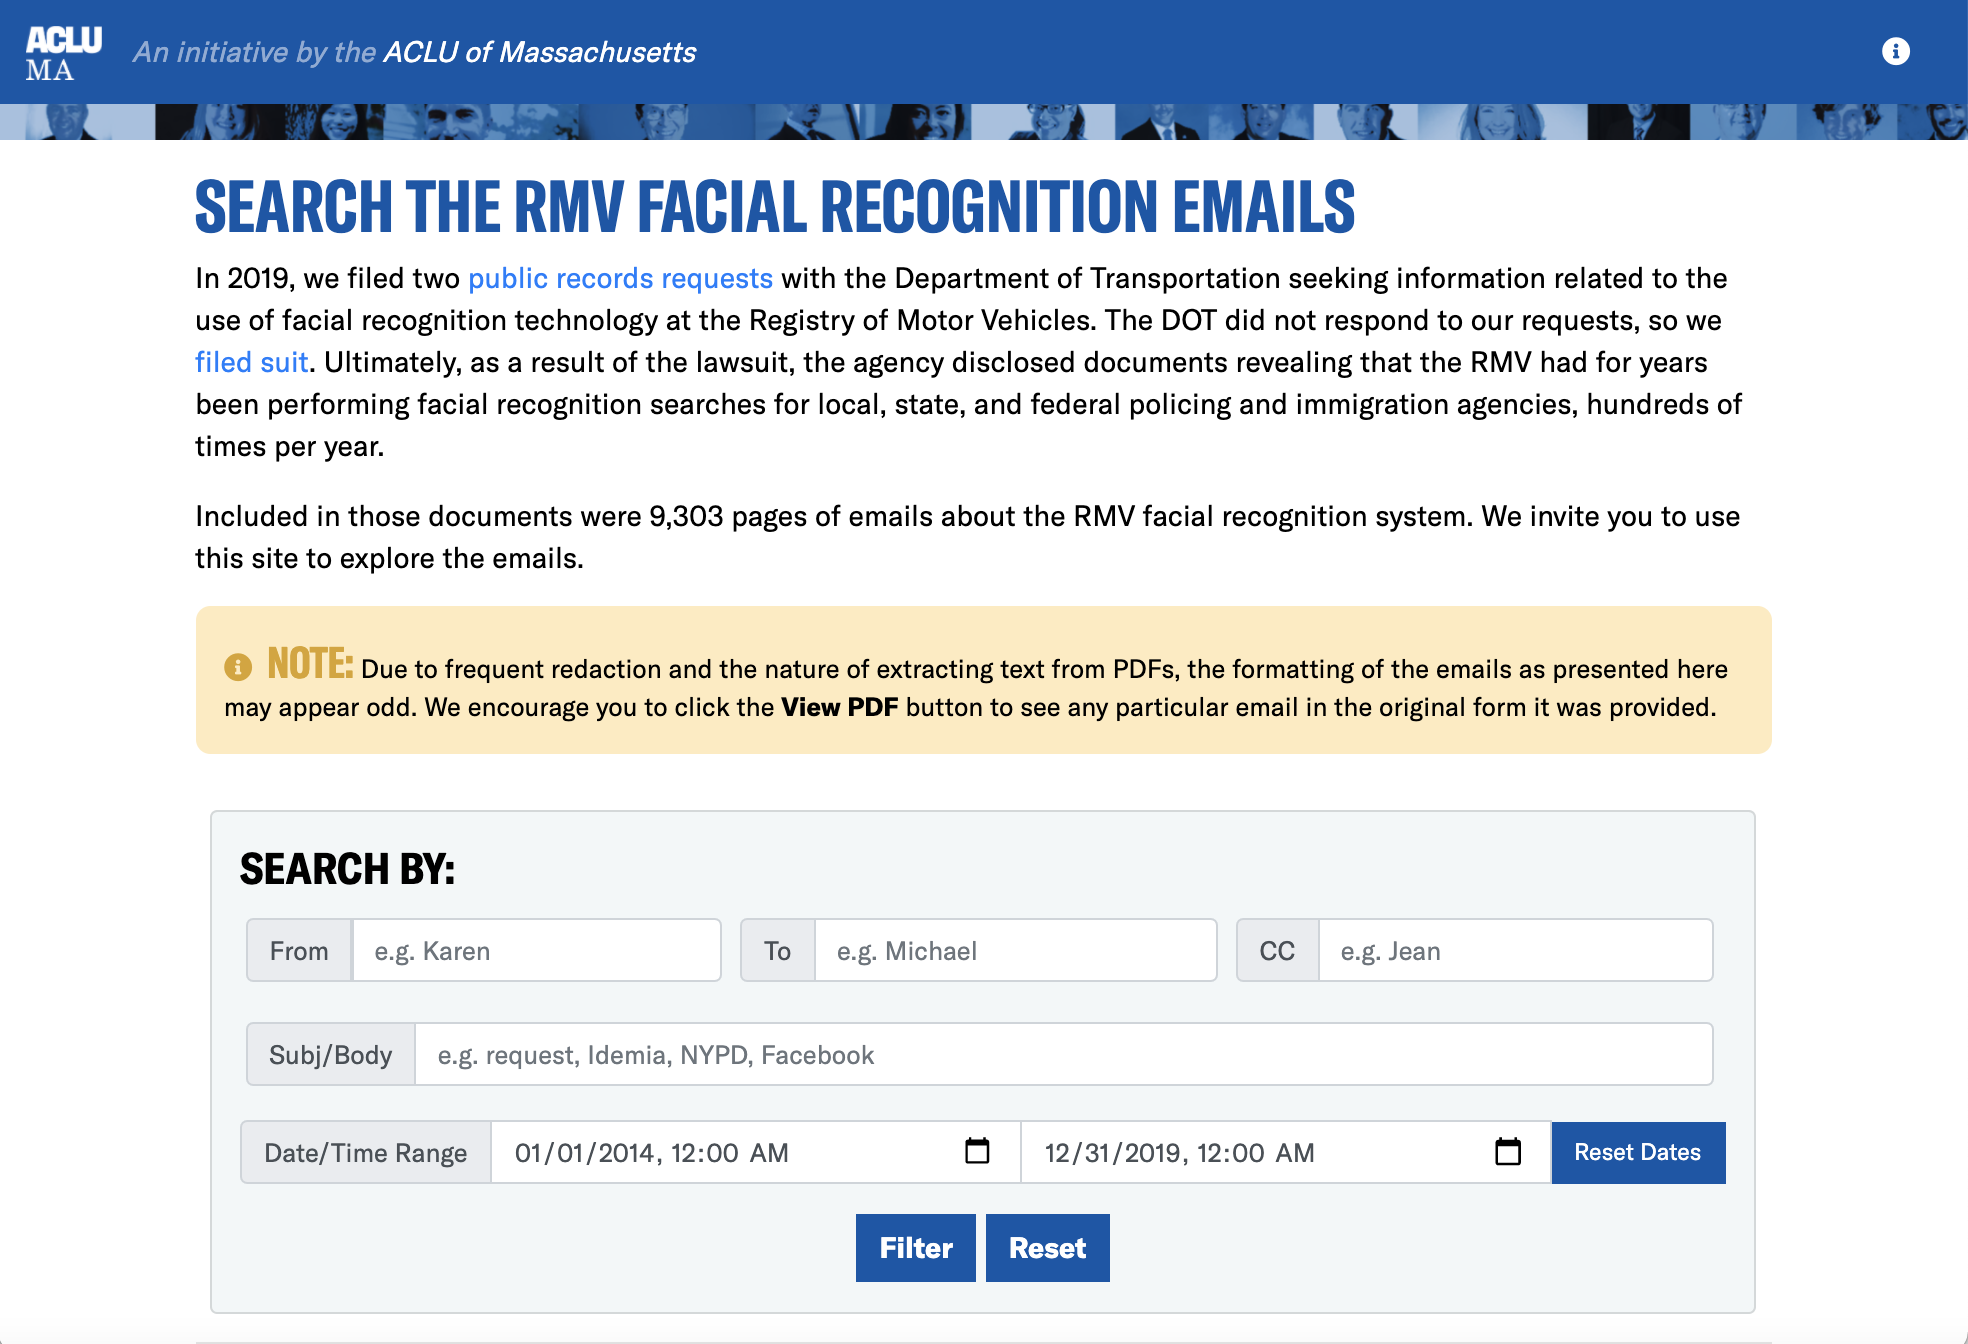
Explore the Facial Recognition Document RepositoryHere we present highlights from this document repository, namely:
- The widespread and unregulated use of facial recognition scans run by the Massachusetts Registry of Motor Vehicles, on behalf of law enforcement agencies across the country
- An aggressive and, in some cases, successful law enforcement marketing campaign by dystopian surveillance startup Clearview AI
- Multiple instances of smaller companies partnering with government agencies to deploy dangerous surveillance technologies without public knowledge
Great Power Without Responsibility: Facial Recognition at the RMV
The largest and most comprehensive state or local government facial recognition program in Massachusetts is managed by the Registry of Motor Vehicles (RMV). This system was put in place in 2006 with the original goal of investigating fraud in the licensing process. Almost immediately after obtaining its facial recognition system fifteen years ago, the RMV told policing entities throughout the state that they could send photos of unknown persons to be searched against its statewide license and identification photo database.
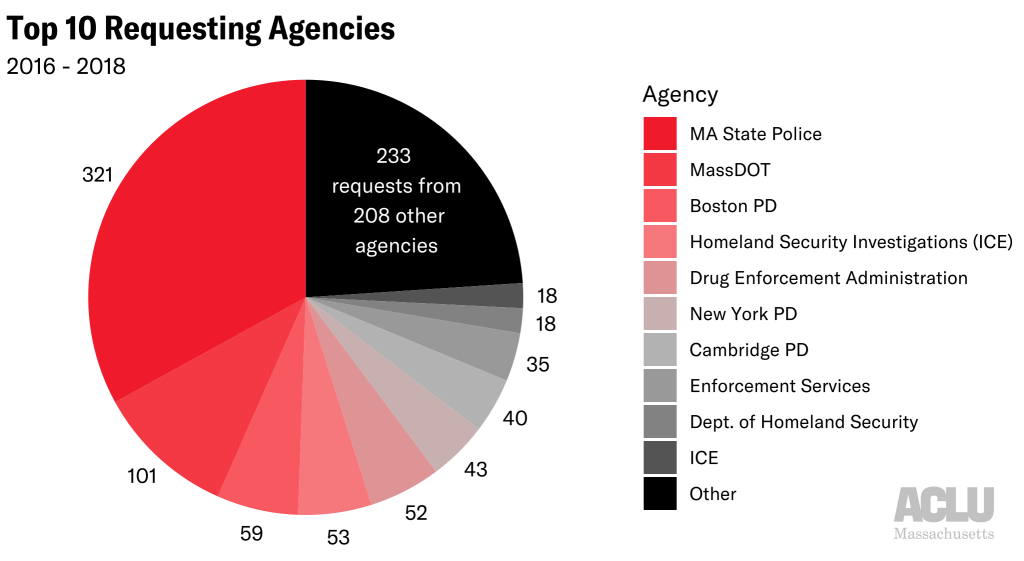
Documents obtained by the ACLU of Massachusetts through a public records lawsuit show that the RMV ran hundreds of scans for police each year, and not just for Massachusetts entities. ICE, the DEA, the Department of Homeland Security, and NYPD all requested scans between 2016 and 2018.
The records show the RMV performed these searches absent any state law or regulations to govern their use, and without any judicial oversight or internal mechanisms to prevent abuse. In order to request a scan, law enforcement and immigration authorities simply sent emails claiming to be from law enforcement, with no verification required. Searches were recorded in written logs only, apparently in red colored pencil, and with spurious reporting standards: over 70 scans were run in 2016 and 2017 on behalf of an employee listed simply as “Karen.” Multiple emails describe scans that were run using photos taken from personal Facebook profiles. According to the records, the RMV did not decline a single search request from any law enforcement official during the time period covered by the records request.
During that period, the RMV facial recognition system was used by a wide range of parties. In Massachusetts, while the Boston and Cambridge Police Departments each submitted dozens of requests, over 30 other departments submitted one or more.
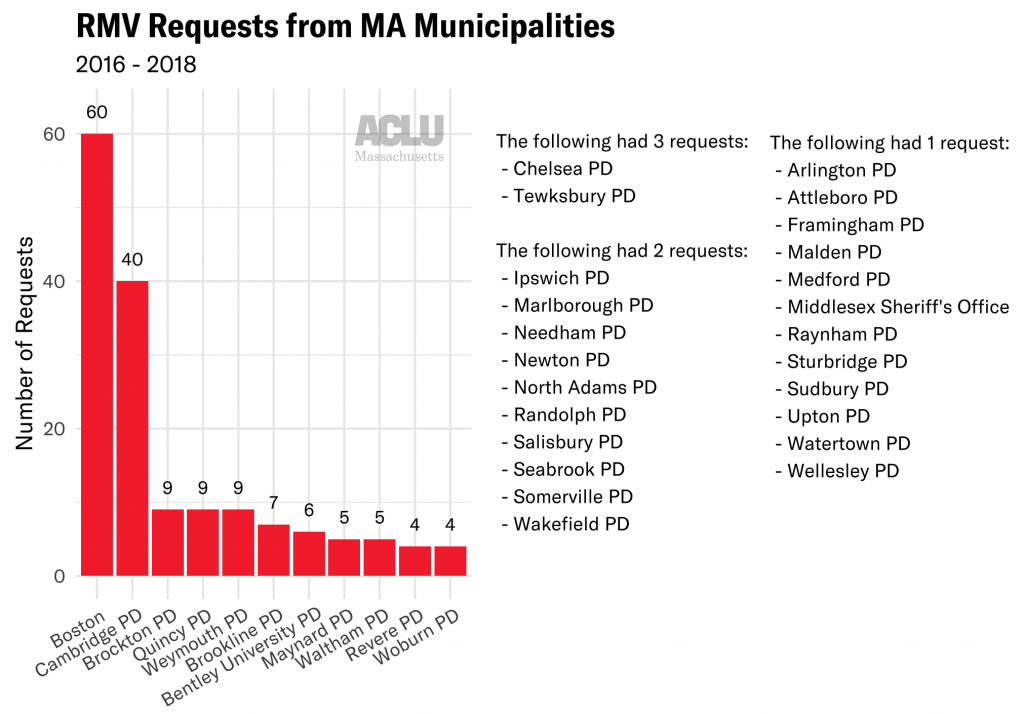
Many officers from out-of-state successfully requested searches, including the South Carolina DMV, the New Hampshire State Police, Rhode Island Police, and the NYPD. Federal agencies took advantage, too: requests appear in the logs from Customs and Border Patrol, the Department of Homeland Security, ICE, the Secret Service, and the IRS.
What was the reasoning behind these scans; were they tied to violent crime investigations, petty theft, immigration, or just an officer curious to dig up dirt on an ex? Did the RMV take steps to mitigate the known racial bias of the software? The RMV’s handwritten logs provide no context. Given that the RMV facial recognition system contains a photo of every individual with a Massachusetts driver’s license or state identification card, these regulatory failures are particularly irresponsible and dangerous.
Dystopia, Get Your Dystopia Here: Clearview’s Marketing Tactics
In 2019, national news stories broke about a terrifying new technology company that links facial recognition results to other content on the internet. With a single facial image, Clearview AI claims it can identify an individual’s photos that are linked to Facebook, Twitter, Flickr, YouTube, and more. Clearview pulls off this freaky feat by scraping billions of images from social media sites— despite being told to cease and desist by multiple companies.
A leak of Clearview’s data in early 2020 revealed widespread use of Clearview by over 2,000 police departments nationally, as well as numerous foreign governments and private companies. Concerned about its adoption in Massachusetts, the ACLU of Massachusetts filed public records requests with every police department in the Commonwealth - 346 in total - to obtain emails mentioning Clearview.
These emails show the company successfully gaining a foothold among Massachusetts law enforcement. At least eight law enforcement agencies statewide accepted Clearview’s invitation to start a free trial of their software: Agawam PD, Marlborough PD, Somerset PD, Wellesley PD, Yarmouth PD, Falmouth PD, Norfolk County Sheriff’s Office, and Oxford PD. In Somerset, the police department originally denied in writing using Clearview until data was leaked revealing one detective had indeed been using a free trial, possibly without the knowledge of department superiors—let alone residents or local elected officials. The detective even used Clearview to run a scan on behalf of an NYPD officer. Such stories demonstrate that in the absence of community control of police surveillance, police and private companies often work together in the shadows to dangerously expand police surveillance tactics.
Records also show an aggressive marketing scheme towards PDs that ultimately didn’t bite: at least 36 Massachusetts police departments received solicitations from Clearview - and probably many more, given that not all record requests were answered. These solicitations were sometimes sent directly from Clearview, but more frequently were sent by publications such as American Police Beat Magazine, Officer.com, or Police Magazine– an indicator of the chilling extent to which facial recognition is marketed to the police. Clearview’s own marketing encourages its users to “take a selfie” or run a search on a celebrity’s photo - behavior that would most likely be barred if the use of the technology were subjected to any sensible rules, regulations, or laws.
Here, There, Everywhere: Facial Recognition Throughout Government
Unfortunately, Clearview and the RMV are just the tip of the iceberg when it comes to government use of facial recognition in Massachusetts. From records requests filed with government offices in over 40 Massachusetts cities and towns, multiple cases arose of small companies peddling dangerous technologies for government use.
In the Town of Plymouth, for example, emails from 2018 reveal extensive communication between the chief of police and Jacob Sniff, the young founder of a billionaire-backed facial recognition startup called Suspect Technologies. At one point during discussion about the Plymouth PD adopting his software, Sniff admits that his product might work just “30% of the time” on poorer-quality images such as those taken from surveillance camera footage. Showing a baffling degree of hubris, Sniff also asks the police department to help him get access to the RMV database - a government system containing personally identifiable information for over 5 million Massachusetts residents. After the ACLU disclosed these emails to the press, the Plymouth Police Department said it would not contract with the company. But these emails show how profit-hungry companies are quietly pressuring even small police departments to buy into unreliable dystopian technologies, and that absent strong law to protect people’s rights and the public interest, police are all too often eager to sign up.
In Revere, we learned that the public school system uses a visitor management software called LobbyGuard that claims to “screen and track everyone who enters your schools.” Though the school district asserts that LobbyGuard does not use facial recognition, the use of such a technology raises concerning questions about privacy and surveillance in school settings, the transfer of sensitive data to little-known corporations, and the role of private companies in expanding government surveillance.
And in the City of Boston, a looming software update from a video analytics company called Briefcam threatened to supercharge all of the region’s networked surveillance cameras with face surveillance software with just the click of a button. Documents from 2019 show that the City upgraded their Briefcam video analytics software to version 4.3. Just a year earlier, Briefcam had launched a new facial recognition feature – in version 5.3. All the City had to do was install a single software update, and the faces of hundreds of thousands of Boston residents and visitors would have begun to be systematically cataloged. Thankfully, a facial recognition ban backed by the ACLU, the Student Immigrant Movement, and many other organizations unanimously passed by the Boston City Council in June makes any such software update illegal in the City of Boston.
What’s perhaps most frightening about these documents is the pattern they suggest: it’s clear that this predatory and biased technology has found fertile ground to take root among Massachusetts government agencies. At least ten municipal police departments have embraced facial recognition technologies provided by unregulated third-party private vendors. And if officers aren’t wary of starting a free trial with Clearview, and police chiefs feel comfortable negotiating contracts with fledgling companies like Suspect Technologies, where would they draw the line?
Without law preventing it, more software trials will be started, more contracts will be signed, and more Massachusetts residents will be endangered. We don’t have to speculate – multiple cases of Black men being wrongfully arrested on the basis of faulty facial recognition scans warn of how this story might end.
These documents further underscore the importance of a newly proposed bill that would impose strict limitations on the use of face surveillance by Massachusetts government agencies. While the state police reform bill that was passed in December 2020 includes some regulations on police use of facial recognition, the newly proposed bill goes much further, prohibiting the vast majority of government agencies from obtaining or possessing the technology and thus protecting Massachusetts residents from aggressive marketing campaigns waged by companies like Clearview and Suspect Technologies. The bill would also enforce a higher standard on police use of facial recognition, requiring a warrant, limiting the technology’s use to serious investigations, establishing key due process protections, and establishing a supervised, centralized process for all facial recognition searches.
![]()
We must enact strong and unambiguous law to govern facial recognition technology - because as these documents show, we cannot trust law enforcement and private companies to regulate themselves.
If you’re interested to learn more about how facial recognition might affect your community, we invite you to visit the Press Pause on Face Surveillance homepage, and explore the document repository on the ACLU of Massachusetts’ Data for Justice Site:
Explore the Facial Recognition Document Repository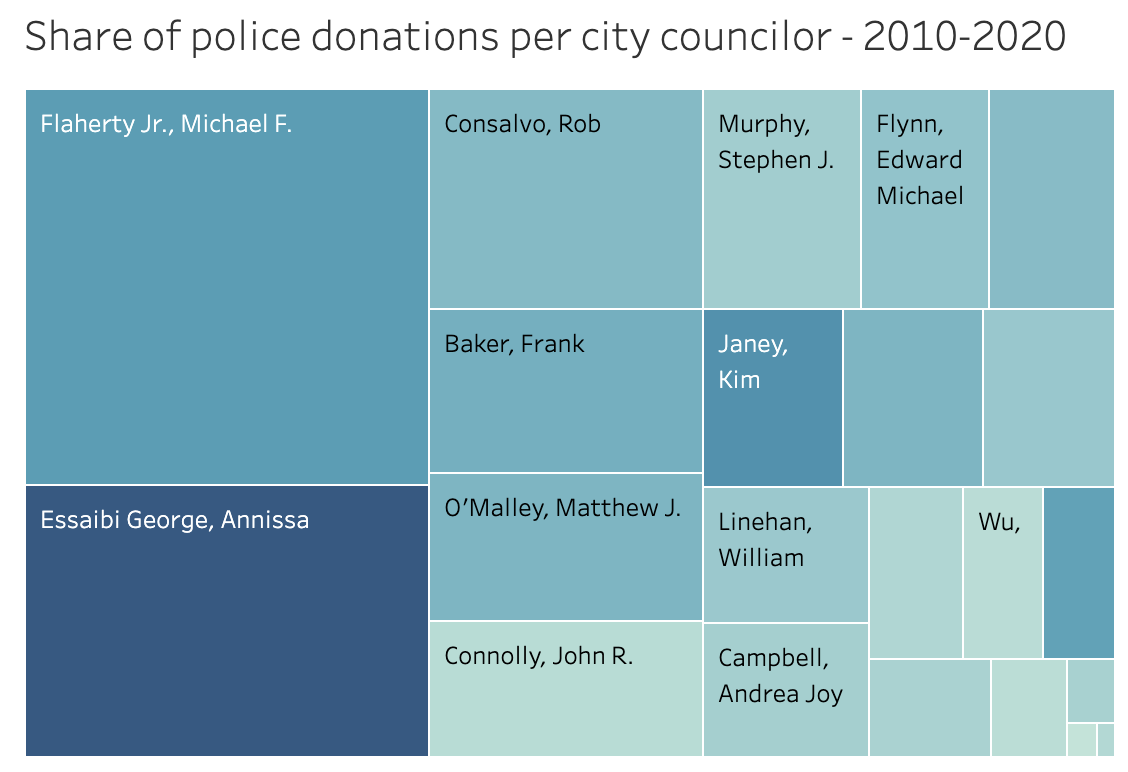
Police in Politics: Tracing Police Contributions to Boston Political Campaigns
In a prior post, the Data for Justice Project explored the huge portion of the city of Boston’s budget spent on policing. The bulk of the Boston Police Department’s budget goes towards payroll. Many Police Department employees earn enormous salaries and overtime compared to other city employees. New analysis shows that the BPD’s overstuffed budget and extraordinarily high pay are matched by large contributions to local candidates by police officers and staff and unions representing them.
It’s a cliché in politics: Follow the money. In that tradition, below we begin to explore which Boston politicians received donations from police or police-affiliated organizations, when, and for how much money.
This analysis was completed by the BU Spark! Data project in collaboration with the ACLU of Massachusetts’ Data for Justice project and Mijente.
Learn More: Visit our project site which hosts detailed visualizations of police campaign donations to Boston politicians.
About the Data
All campaign donation data presented here are publicly available in raw form at the Massachusetts Office of Campaign & Political Finance (OCPF).
In determining which political donations originated from police, our analysts included occupations within the Boston Police Department, as well as police membership organizations elsewhere in Massachusetts and around the country. Please note that occupation and employer are self-reported by the person making the contribution.
Our team analyzed contributions from the past ten years for Boston City Council members and the Mayor.
Police Contributions to Mayor Walsh
As the chief executive in a strong-mayor system, Boston Mayor Marty Walsh attracted the lion’s share of police donations in the city, totaling $456,548 in the last decade. While the donations began with Walsh’s first run for mayor in 2013, Walsh has seen consistent support every year since.
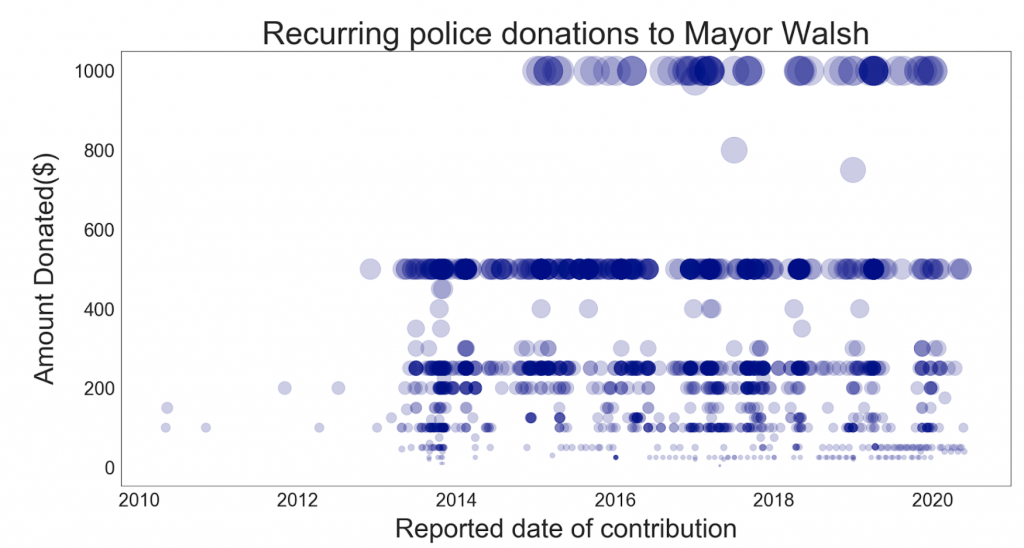
Individual and PAC/Union Police Contributions to Mayor Walsh, 2010-2020
Visualization by BU Spark!
The data shows that Mayor Walsh receives a steady stream of police donations month after month, year after year. This includes large and small amounts in contested election years as well as off-years. Mayor Walsh maintains a median police-related donation of as much as $250 across a total of 1477 donations for the last ten years of data.
Police contributions to the Walsh campaign align to the campaign’s general fundraising pushes. As you can see below, contributions from police have historically peaked around the same time that Walsh’s overall fundraising peaked.
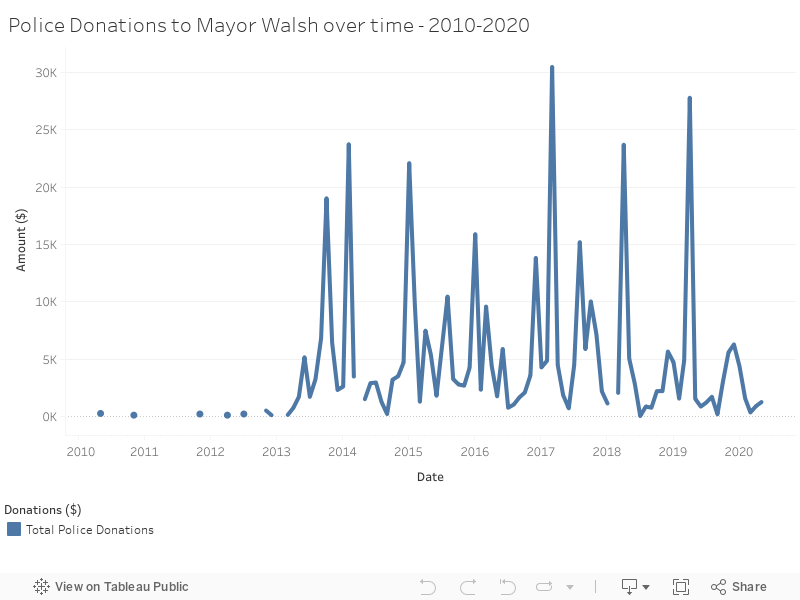
Police contributions to Mayor Walsh over time, 2010-2020
Visualization by BU Spark!
Where do the police who have donated to Mayor Walsh live? While many police donors to the Walsh campaign live in Boston, the data shows that many others live in cities and towns across Eastern Massachusetts.
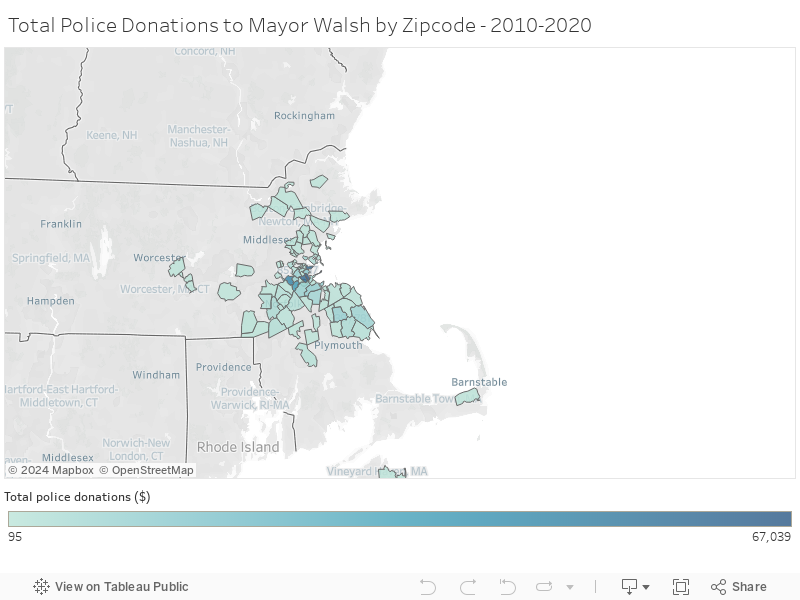
All police contributions to Mayor Walsh by zip code, 2010-2020
Visualization by BU Spark!
The top three most profitable zip codes for police contributions to the Walsh campaign are in Boston, including 02122 (Dorchester-Neponset/Port Norfolk, total: $68,589), 02124 (Dorchester-Ashmont/Lower Mills/Codman Sq, total:$58,961), and 02127 (South Boston, total: $57,375). Yet overall, 26% of the Mayor’s police-related campaign support came from residents outside of Boston, whether BPD employees or not.
Police contributions to Boston City Councilors
Mayor Walsh isn’t the only Boston politician with strong, consistent financial backing from police. Police contributions to currently serving Boston City Councilors in the last decade totaled $114,276—approximately one fourth of the total police support to Mayor Walsh. Councilor Michael Flaherty, who has served on the council as a Councilor At-Large since 2000, tops the list. Police contributed $38,700 to Councilor Flaherty in the years 2010-2020.
Police-related contributions to Councilors vary widely. Some councilors received tens of thousands of dollars from police and some received just hundreds. And two councilors newly elected in 2019—Councilors Kenzie Bok and Liz Breadon—have not received any police-related contributions.
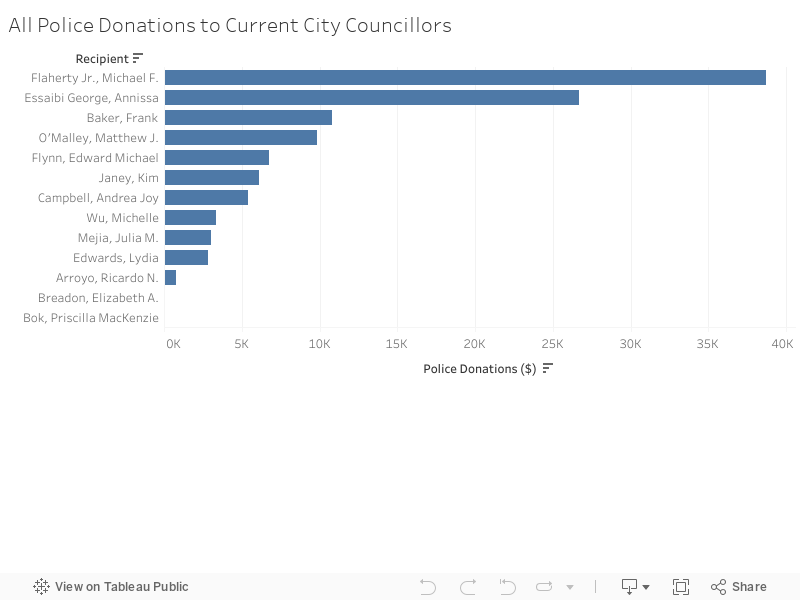
Individual and PAC/Union Police Contributions to Current City Councilors, 2010-2020
Visualization by BU Spark!
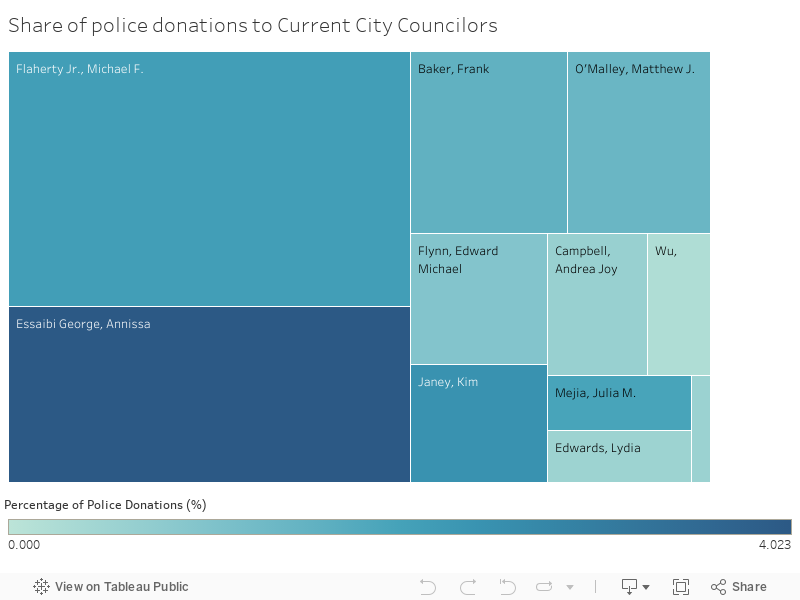
Amount (size) and percent (color) of Police Contributions to Current City Councilors, 2010-2020
Visualization by BU Spark!
In the above visualization, the darker the color of a Councilor’s rectangle, the higher the percent of total contributions made to that Councilor by police. The larger the block, the greater the total police contribution amount. Councilor Flaherty leads in total financial support while Councilor Essaibi George leads in percentage of contributions coming from police.
Councilors Flaherty and Essaibi-George jointly account for a bit over half (56%) of police contributions. As a share of total contributions, Flaherty received 2.13% from police. Councilor Essaibi-George has served a shorter period, though her share of police donations is larger at 4%. Councilors with the smallest share of police donations include Councilors Wu (0.23%), Edwards (0.52%), Arroyo (0.54%) and Campbell (0.60%).
For many reasons, police nationwide have outsized influence on local and state politics. As concerned community members, we must ensure government officials are held accountable to all of their constituents, not just those with the most money or political clout.
Learn More:
- Explore the OCPF political donation data
- Follow news about Boston’s police unions role in local politics. Here is one important report. Boston police have been outspoken in their opposition to the Movement for Black lives and to political leaders who provide support
- Check out this recent USA Today article highlighting the unchecked political influence of police and police unions across the country
Take action:
- Sign up for project partner BU Spark!’s newsletter to learn more about BU student tech projects
- Sign on and support project partner Mijente.org on the front lines in Latinx communities for social and criminal justice
- Join to become a card carrying member of the ACLU of Massachusetts
- Learn how to file a complaint against the Boston Police: https://openpolice.org/dept/MA-boston-police-dept
To learn more or get involved with the Police in Politics project, please email police-in-politics@aclum.org.
The Police in Politics project is a partnership between Mijente, BU Spark!, and the ACLU of Massachusetts to investigate police donations to Massachusetts politicians. It is supported by some great technical volunteers, including Steve Backman.
Break Up with the BRIC: Unpacking the Boston Regional Intelligence Center Budget
Explore all of the ACLU of Massachusetts' analysis on policing in the Commonwealth.
On Thursday, July 23, the Boston City Council is holding a hearing on three grants that would collectively approve over $1 million in additional funding to the Boston Police. These taxpayer dollars would go towards installing new surveillance cameras across Boston and funds for the Boston Regional Intelligence Center, or BRIC.
Thursday’s hearing is a re-run from a routine hearing which took place on June 4, in which the Boston City Council was slated to rubber-stamp these three grants - dockets #0408, #0710, and #0831. However, community advocate groups such as the Muslim Justice League rallied, urging the Councilors to be critical of – and ultimately reject – the BPD grants. Ironically, the BRIC representative failed to make an appearance at the hearing and the question of the grant approval was tabled for this future date.
Out-of-control funding of the Boston Police is nothing new - as discussed in an ACLU of Massachusetts analysis, in FY21 the initially proposed Boston Police budget was $414 million. Ultimately, the Boston City Council still approved $402 million for the BPD, despite thousands of constituents advocating for more substantial budget cuts.
However, specific scrutiny of the BRIC and its funding is long overdue. In recent years, city, state, and federal legislatures have authorized well over $7 million in funding for the BRIC each year. But due to BPD secrecy surrounding all things BRIC-related, it’s hard to paint a full picture of what the BRIC does with this funding. Indeed, the description of the program on the Boston Police Department website consists of a mere 122 words - so we are forced to consult alternate sources and public records requests to get any details.
A new analysis of public records by the ACLU of Massachusetts takes a closer look at where the BRIC’s money comes from -- and what it’s used for.
What is the BRIC?
The Commonwealth of Massachusetts is home to two federal fusion centers: Department of Homeland Security-funded centers established after September 11th, which facilitate information sharing between local, federal, and state law enforcement. One such center, the Commonwealth Fusion Center, is operated by the Massachusetts State Police, while the second, the Boston Regional Intelligence Center, or BRIC, is operated by the Boston Police Department.
The BRIC operates across the entire Metro Boston Homeland Security Region (MBHSR), which includes Boston, Brookline, Cambridge, Chelsea, Everett, Quincy, Revere, Somerville, and Winthrop.
Ample and Diverse Funding
According to public records obtained and compiled by the ACLU of Massachusetts, the BRIC is funded by a combination of federal, state, and local budgets and grants.
Specifically, the BRIC receives funding from at least four distinct sources:
- Department of Homeland Security (DHS) Federal Emergency Management Agency (FEMA) Urban Areas Security Initiative (UASI) grants
- Massachusetts Executive Office of Public Safety and Security (EOPSS) yearly allocations, most likely from the DHS FEMA State Homeland Security Grant program
- Massachusetts state budgets (passed through the Executive Office of Public Safety and Security (EOPSS); line item 8000-1001)
- City of Boston operating budgets (via the Boston Police Department’s Bureau of Intelligence & Analysis)
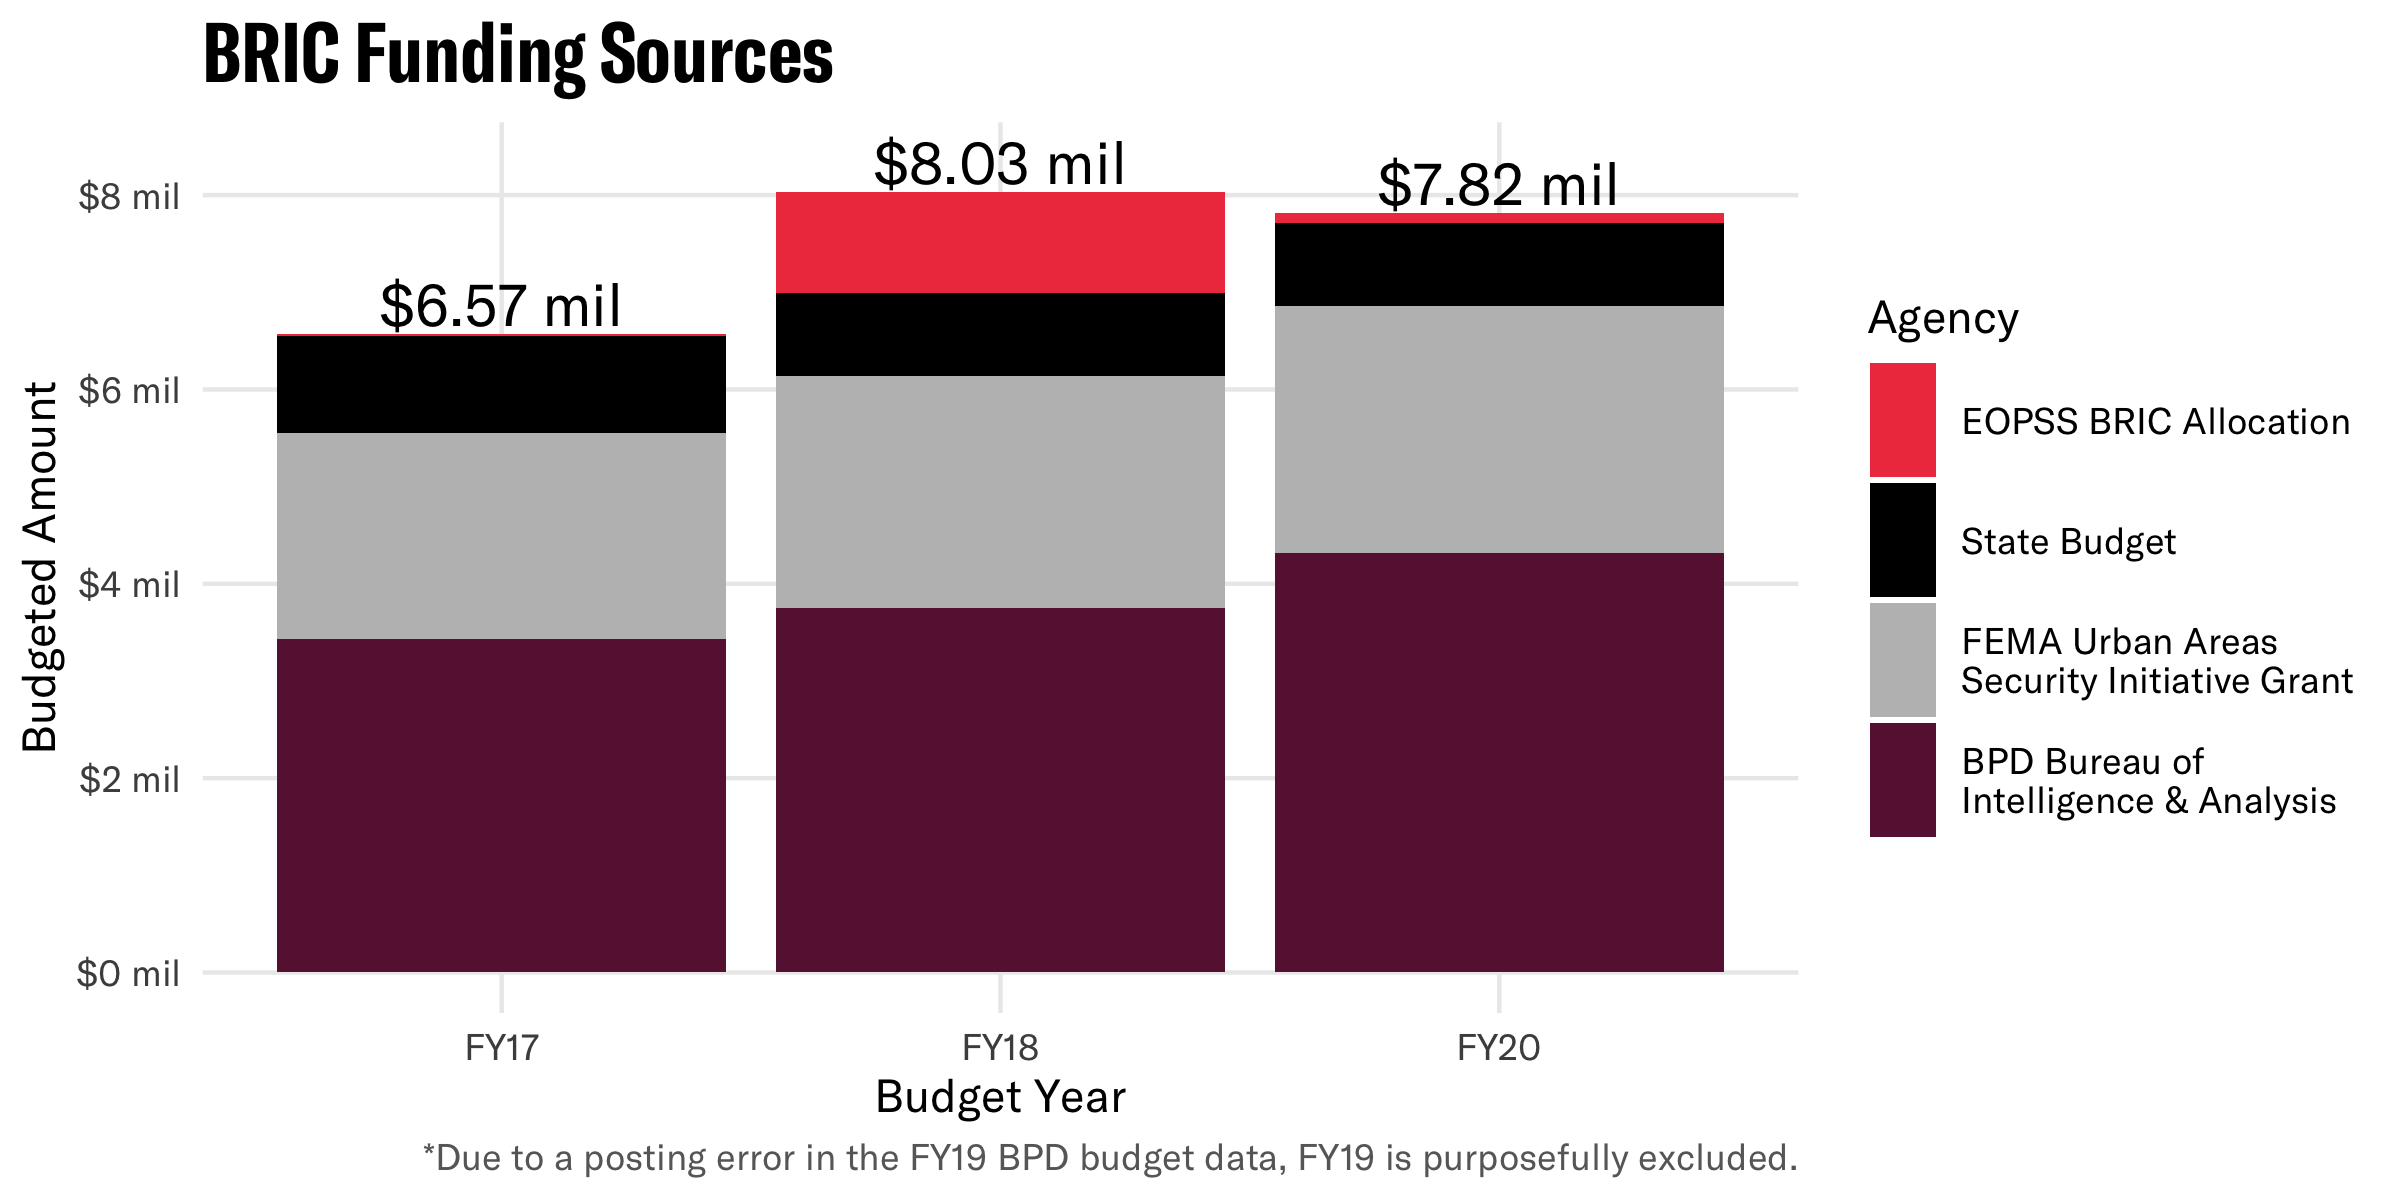
These four funding streams combined lead to the BRIC receiving approximately $7-8 million each year in public funds.
Note that correspondence with the City of Boston revealed that publicly available data for the FY19 BPD Bureau of Intelligence & Analysis budget is incorrect due to a “posting error”, and so FY19 is excluded from all figures.
Additionally, it’s important to note that due to the lack of transparency, these four sources might not encompass all of the funding coming into the BRIC. For instance, a FY21 report of BPD contracts shows $4 million in payments for “intelligence analysts” to Centra Technologies between 2018 and 2021, likely working at the BRIC. If so, the BRIC budget may indeed be millions of dollars greater than what we are able to report today.
Who’s on the payroll?
How many people do work for the BRIC – and get their salaries from its budgeted funds? Ten? Sixty? It’s difficult to know.
Expense reports reveal at least 41 employees received training from the BRIC between 2017 and 2019 - but 10 of these names do not appear on the City of Boston payroll for those years.
Records show that the BRIC has some dedicated employees: in FY20, the personnel budget for the BPD’s Bureau of Intelligence and Analysis - whose sole charge seems to be the management of the BRIC - was $4.3 million. And in 2019, BRIC expense reports show $1.8 million in payments towards contracted “Intelligence Analysts” through companies such as Centra Technology, The Computer Merchant, and Computer and Engineering Services, Inc. (now Trillium Technical). But would this $1.8 million support 7 analysts making $250k per year? 30 analysts at $60k? The records do not provide clarity on this point.
Finally, confusion around one of the grants being discussed at Thursday’s hearing, proposed in docket #0408, further epitomizes the BRIC’s financial obfuscation around its payroll. The docket formally proposes $850,000 in grant funding to go towards “technology and protocols.” However in discussion at the June 4 hearing it was revealed that, in actuality, part of the grant would go toward hiring 6 new analysts.
By keeping under wraps the roles and job titles of BRIC employees, and even simply the size of the Center, BRIC obstructs transparency, public accountability, and city council oversight.
Hardware and Software Galore
Between 2017 and 2020, BRIC expense reports show the Center spent almost $1.3 million on hardware and software. Thorough review of these reports reveals exorbitant spending: on software of all flavors, scary surveillance technologies, frivolous tech gadgets, and some obscure mysteries.
A number of the expenses are clearly for surveillance cameras and devices, including $106,700 in orders for “single pole concealment cameras”. These pole cameras were bought from Kel-Tech Tactical Concealments, LLC, a company which also supplied the BRIC with some truly dystopian concealment devices such as a “Cable splice boot concealment” ($10,900), a “ShopVac camera system” ($5,250), and a “Tissue box concealment” ($4,900). These purchases imply the BRIC is hiding cameras in tissue boxes, vacuum cleaners, and even electrical cables.
Some of the charges on the report are just too vague to interpret. This includes the largest hardware/software charge in the entire report: $164,199 paid to Carousel Industries for “BRIV A/V Upgrade per Bid Event”. There’s $36,997 in “Engineering Support”, paid to PJ Systems Inc. and $15,606 in a “C45529 CI Technologies Contrac[t]”, paid to CI Technologies. And concerningly, there is a cumulative $16,200 in charges described simply as “(1 Year) of Unlimited” paid to CovertTrack Group Inc. – a company which also supplied the BRIC with a “Stealth 4 Basic Tracking Devic[e]” to the tune of $7,054.
When it comes to computing hardware, there’s no skimping either. Reports show over $200,000 in expenses for servers, and over $67,000 for various laptops. And apparently the BRIC prefers Apple products - judging by the $10,000 they spent on iPad pros, almost $1,000 on Apple Pencils, and $367 on Apple TVs.
Yet the most indulgent spending is on software. Between 2017 and 2020, the BRIC purchased at least 13 specialized software products for intelligence analysis, crime tracking, public records access, device extraction, and more.
| Software | Use | BRIC Expenses 2017-2020 |
| IBM i2 | “Insight analysis” | $124,852 |
| CrimeView Dashboard | Crime analysis, mapping and reporting | $58,009 |
| Accurint | Public records searches | $32,803 |
| Esri Enterprise | Geospatial analysis | $27,000 |
| Thomson Reuters’ CLEAR | Public records searches | $25,322 |
| CrimNtel GIS | Crime analysis, mapping and reporting | $21,016 |
| Computer-Aided Dispatch (CAD) Interface | Emergency response | $16,387 |
| Cellebrite Universal Forensic Extraction Device (UFED) Ultimate 4PC | Device data extraction | $12,878 |
| CaseInfo | Case management | $10,508 |
| NearMap | Geospatial analysis | $9,995 |
| ViewCommander-NVR | Surveillance camera recording | $3,778 |
| eSpatial | Geospatial analysis | $3,650 |
| XRY Logical & Physical | Device data extraction | $2,981 |
And worse, there is redundancy between the products - the BRIC purchased three different geospatial analysis products, two public records search products, and two device data extraction products.
This smorgasbord of tools begs the question: What, if any, supervisory procedures exist within the BRIC to prevent irresponsible spending of taxpayer dollars on expensive, duplicative software?
And furthermore, some of these public records databases give users immense power to access residential, financial, communication, and familial data about almost any person in the country. So who, if anyone, oversees the use of powerful surveillance databases like Accurint and CLEAR, to ensure they aren’t being used to violate basic rights and spy on ex-girlfriends?
From a history of First Amendment violations in Boston, to their role in threatening local immigrant students with deportation, to a 2012 bipartisan Congressional report concluding fusion centers such as the BRIC have been unilaterally ineffective at preventing terrorism, there is much evidence in support of the BRIC being wholly defunded. But at the very least, the Boston City Council must end the practice of writing blank checks for the Boston Police to continue excessive and unscrutinized spending of taxpayer dollars.
The Boston City Council must reject the additional $1 million in funding to the Boston Police being proposed in these three grants. To learn more about the BRIC, the proposed grants, and to urge the City Council to reject them, we encourage you to:
- Consult the Muslim Justice League Toolkit to Get the BRIC Out of Boston
- Sign a petition telling Boston City Councilors to reject BRIC-related grants before Tuesday, July 28
- Submit written testimony for the BRIC budget hearing before 9:30 AM on Saturday, July 25, telling Boston City Councilors to reject BRIC-related grants

Bond Bill Funds Prisons and Police over Education
Editor's Note: Today, the Senate Bonding Committee gave S2579: the General Government Bond Bill (previously H.4733) a favorable report. Last week, the committee on Senate Bonding, Capital Expenditures and State Assets concluded hearings on this bill. We are glad to see that the committee added limiting language to ensure that the $150 million authorization for public safety facilities would not be spent on building new prisons or jails. As the bill advances to Senate Ways and Means, we hope to see more amendments that prioritize investment in communities rather than policing and prisons.
What is the “General Government Bond Bill” and why should we care?
Last week the committee on Senate Bonding, Capital Expenditures and State Assets concluded hearings on H.4733, the General Government Bond Bill (originally H.4708). This Bond Bill intends to finance general governmental infrastructure of the Commonwealth around “public safety, information technology and data and cyber-security improvements.”
Bond bills are borrowing bills which pass on not just debt to future generations but also values. Given the huge disparities the pandemic has both exposed and created through mandatory remote learning, the top priority for any debt for future taxpayers should in fact be their current education. The COVID-19 pandemic has shown how crucial basic broadband infrastructure is to ensure equitable access to education. Education Commissioner Jeff Riley testified last month to the need of $50 million to support MA school districts to reach students without internet access (9% of students) or exclusive use of a device (15% of students).
Instead, this bill allows for at least $270 million to build prisons, acquire police cruisers and other equipment for the Department of Corrections. The events of the last few weeks have shown the unnecessary, unwise, and unjust investment in the criminal legal system -- a system that over-polices, over-prosecutes, and over-incarcerates Black and Brown communities in the Commonwealth. The bill’s funding priorities need to be flipped.
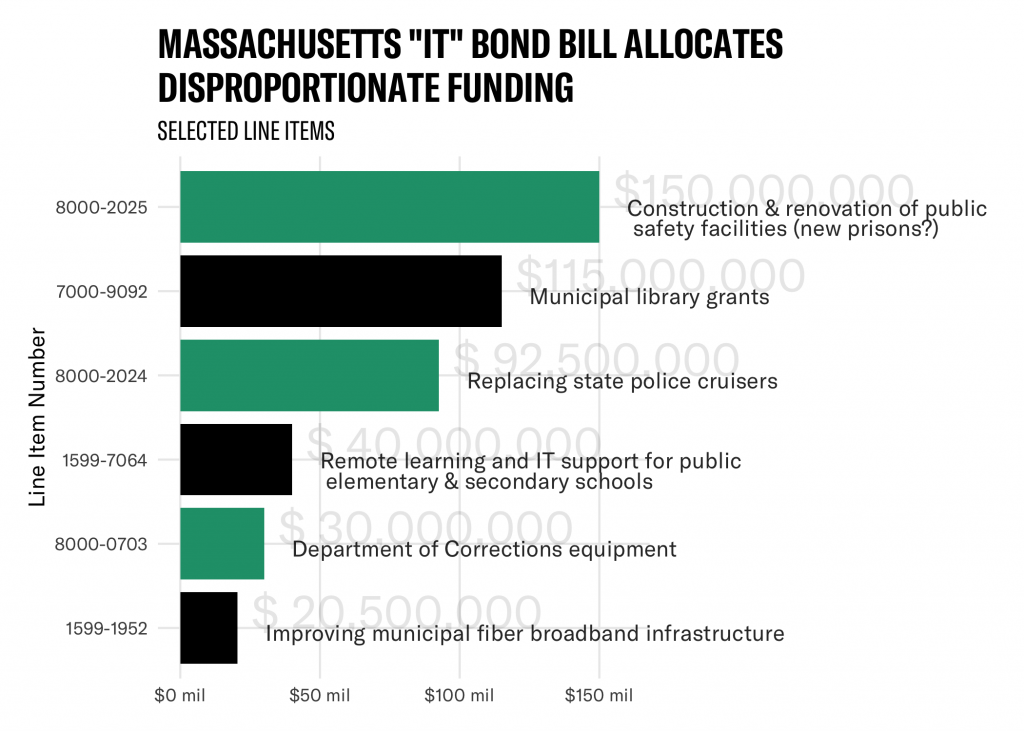
As the Boston advocacy organization Families for Justice as Healing states in their call to action against H.4733, "The Commonwealth already spends more money per capita on law enforcement and incarceration than almost any other state. Communities need capital money for critical infrastructure projects like housing, carte facilities, parks, schools, treatment centers, healing centers, community centers, and spaces for art, sports, and culture."
Why are we still investing in police and prisons?
Over the last week, the world has watched as protests against police brutality and unaccountability have been met with further use of excessive force on protestors. As we live through the historic Black Lives Matter movement, the ACLU of Massachusetts (ACLUM) has joined the calls of Black and Brown-led organizations to divest from police in favor of investments in systems that support, feed, and protect people.
There have been demands from across the country to defund police departments, with the Minnesota City Council declaring its intent to disband the police department all together. The timing of further funding of police departments is incomprehensible at this watershed moment for racial justice across the country and in the midst of an economic freefall due to the COVID-19 pandemic.
Bond bill H.4733 does not meet this moment. In testimony to the Senate Committee on the Bond Bill, ACLUM strongly opposed line item 8000-2025, which would authorize an enormous amount of borrowing to build prisons. Families for Justice as Healing also opposed this line item, testifying that "significant decarceration is possible and further decarceration is doable and practical under current law, and at a cost-savings to the commonwealth."
ACLUM also opposed line item 8000-0703, authorizing the borrowing of $30 million for the purchase of Department of Corrections and Executive Office of Public Safety and Security for equipment and vehicles, and line item 8000-2024, authorizing the borrowing of $92 million for the purchase of police cruisers. (This is enough to put over $40,000 towards a new or improved car for all 2,199 Massachusetts State Police employees.)
Even without bond funds, police departments across the Commonwealth and the country are incredibly well funded. As previous ACLUM analysis of the City of Boston budget on Data for Justice shows, compared to the budgets of other Boston City departments (and cabinets), the Boston Police budget is exponentially higher than that of community focused organizations like Library, Neighborhood Development and Office of Arts and Culture.
Why aren’t we investing in actual information technology infrastructure?
Instead of authorizing new debt to build prisons and increase police budgets, we should be investing in information technology to support educational equity throughout the Commonwealth. In that way, this bond bill could truly reflect values we want to pass down to our children.
At present, the line item 1599-7064 is the only one which directly does this, authorizing $40 million to help close the digital divide for students in the Commonwealth. Certain emergency measures have been taken by school districts to enable transition to remote learning such as tablets and free access to assistive technology. However a bill that is intended to finance the general governmental infrastructure of the Commonwealth, and in particular to provide assistance to public school districts for remote learning environments, should invest in more than $40 million in state-wide digital infrastructure to permanently close the digital divide.
What exactly do we need to invest in?
Data from the United States Census American Community Survey show that about 8% of households either do not have a computer, or if they do, do not have access to the internet at all. Furthermore, more than 1 million Massachusetts residents (> 15%) do not have a fixed broadband internet connection.
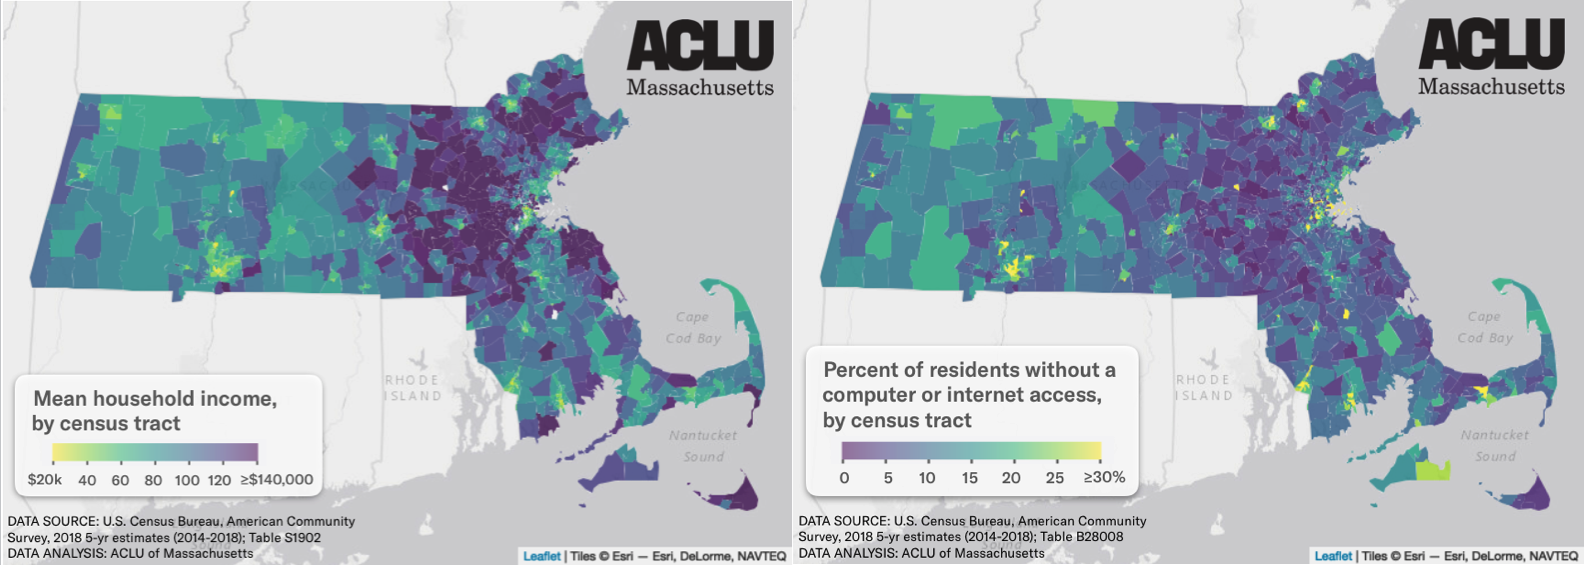
As reported in a previous analysis by the ACLU of Massachusetts, lower rates of internet access or broadband correlate with lower income, both in terms of macroscopic geography (e.g. southern and western Massachusetts), and low-income neighborhoods within cities. 8 cities in Massachusetts have at least 30% of households without cable, DSL or fiber Internet subscriptions in 2018 - Fall River, Springfield, Lowell, Lawrence, Worcester, Lynn, New Bedford and Brockton.
Taking a closer look at Brockton for example: of the households in the lowest two income categories, less than 50 percent have broadband internet access. This is similar to the pattern of better connected cities such as Newton. Here too, about 50 percent of households in the lowest two income categories do not have broadband. Thus from the perspective of a household, one's income is a stronger indicator of access to the internet, even if one is living in an area which generally has robust high speed internet connectivity.
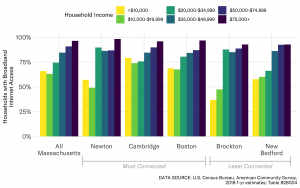
Divest - Reinvest
Bond bill H.4733 singles out certain cities for specific projects. Brockton, for example, is slated to get $2,000,000 for enhanced security camera systems at public housing buildings Campello and Sullivan towers. Instead of investment in broadband, Lawrence, which ranks 28th on the list of 623 worst connected cities in the country, is going to get $2,500,000 for police cruiser technology.Thankfully Springfield, ranked 24 on that list, is slated to get $7,500,000 for a citywide fiber network.
Beyond Education Commissioner Jeff Riley’s testimony on the need of $50 million for remote elementary and secondary education, State and community colleges are in dire need of funding as well. The community colleges’ chief financial officers recently tallied the costs of additional information technology at nearly $17 million.
Rather than expanding the racist carceral state, we should use this Bond Bill to create equitable digital infrastructure to even out the playing field for the future generation.