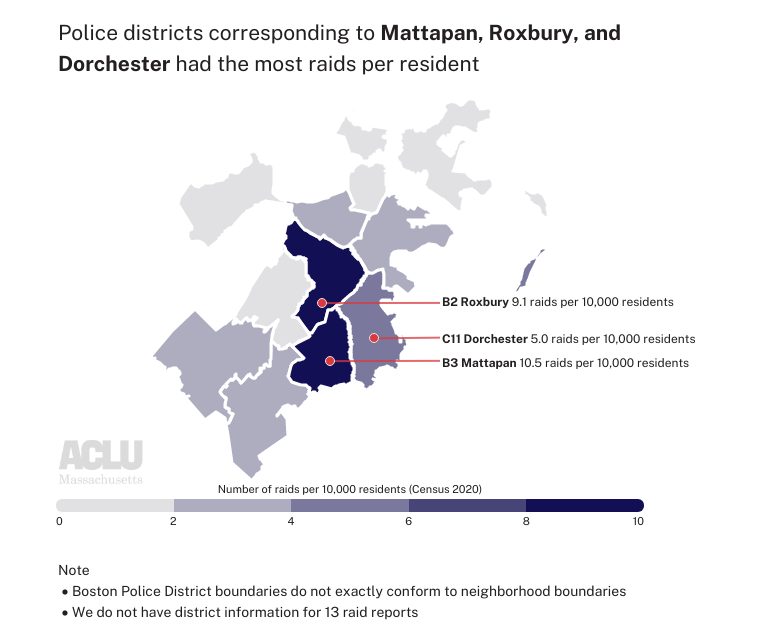
Investigating Boston Police Department SWAT Raids from 2012 to 2020

Today, the ACLU of Massachusetts released a new interactive tool allowing members of the public to visualize and analyze nearly a decade of Boston Police Department SWAT team after-action reports. An ACLU analysis of these reports has identified troubling racial disparities in BPD SWAT raids, particularly when those raids involve drug investigations. 

Review Boston Police SWAT After-Action Reports

About the data 

This analysis draws on after-action reports of BPD SWAT incidents from 2012 to May 2020. After-action reports are created by the BPD SWAT team to document the unit’s deployments. The reports include descriptions of the incident, information about the people involved (the police, targets, and others impacted), the geographic location of the deployment, and details about the level of police force used during the SWAT action, among other details. The BPD released these reports in response to a 2020 subpoena from then-City Councilor Michelle Wu.  

Unfortunately, the documents produced by the BPD were difficult to analyze in bulk; among other problems, they were not machine readable. While the ACLU and our partners made every attempt to ensure the accuracy of the data pulled from these reports, our analysis has some data limitations. For example, the underlying after-action reports occasionally include missing, clearly incorrect, or difficult-to-interpret data. As explained in greater detail in the methodology section at the bottom, some errors may also have arisen in our processing of the records and extraction of information. That said, we engaged in a human review of the documents to ensure any errors in our extraction do not impact the overall analysis of trends.  


The data: Disproportionate SWAT policing of Black and Brown communities and people

There are 262 after-action incident reports representing deployments between 2012 and May 2020. A significant portion of these police actions took place in police precincts roughly corresponding to the neighborhoods of Mattapan, Roxbury, and Dorchester.  

According to data reported by the Boston Planning & Development Agency Research Division, these three neighborhoods had the highest percentage of residents who are non-white (i.e., identifying as a race other than white or as white along with one more other races) of any Boston neighborhood in 2020. These neighborhoods also had a relatively higher share of residents identifying as Black or African American and/or Hispanic than most other Boston neighborhoods.   

After-action reports typically list one or more incident types indicating the reason(s) for the raid. In order of frequency, the most common types were Search Warrant – Other/Unknown, Search Warrant – Drugs, Mental Health Crisis, and Barricaded Suspect. 

Like other SWAT teams, the BPD SWAT unit is deployed in response to active crises and in deliberate, planned SWAT raids. Typically, the latter cases involve the serving of search and arrest warrants. While the BPD has discretion about whether to deploy the SWAT unit in response to calls for service, SWAT deployments pertaining to active emergencies like mental health crises, barricaded suspects, and domestic violence incidents are nonetheless responsive to active emergencies in the community. On the other hand, the deployment of the SWAT unit to serve warrants, particularly search warrants, is more reflective of self-directed police work. For that reason, racial disparities in the use of SWAT units to serve search warrants are a significant cause for concern.  

Data indicate that white and Black people in the United States use and sell drugs at approximately the same rates. But the BPD’s SWAT unit serves drug warrants almost exclusively on people of color.  

The data: Targets of the BPD's SWAT raids

According to the after-action reports, 784 people were subjected to SWAT raids between 2012 and 2020. 270 of these individuals were specifically marked as the “suspects” or “targets” of the raid.  

The ages of all raid subjects ranged widely from infants to 83-year-olds. Individuals between 20 and 40 years old were the largest group impacted. For those marked specifically as raid suspects or targets there is a smaller range of ages; the youngest person was 16 and the oldest was 67.  

According to the reports, 105 children under the age of 18, including 25 children under the age of 5, lived in homes subjected to BPD SWAT raids between 2012 and early-2020. 

Those impacted by raids were predominantly men, accounting for 88% of those targeted by raids and 62% of all individuals subjected to raids. When considering both race and gender, Black men were the largest group of those both subjected to raids (38%) and marked as raid suspects/targets (50%).

There are significant racial disparities in those targeted and all those impacted by raids 56.3% of those targeted by raids were Black non-Hispanic and 8.5% were Black Hispanic. These figures are disproportionate to the share of Black residents in Boston. As of the 2020 Census, 25.5% of Boston’s population was Black or African American; this figure includes multiracial residents and both Hispanic and non-Hispanic residents. Of this, 22% of Boston’s population was Black non-Hispanic, and 3.4% was Black Hispanic. Hispanic residents are also disproportionately impacted by raids. 28.7% of those targeted by raids were recorded as Hispanic, White Hispanic, or Black Hispanic; however, the 2020 Census found that Hispanic or Latino residents made just 19% of Boston’s population. 

The disproportionate share of Black and Hispanic individuals impacted by raids varies by incident type; the disparity is notable in “officer-initiated” raids* such as those for search warrants. In contrast, the demographics of people subjected to SWAT team involvement in crisis-related incidents, such as mental health crises, more closely reflect the demographics of Boston.  

*To better understand BPD SWAT unit practices, we categorized incident types into “officer-initiated” incidents such as search warrants or arrest warrants and “crisis-related” incident types that reflect an emergency such as a mental health crisis. 

Another way to view this disparity is to look at the share of white non-Hispanic residents impacted by raids. White non-Hispanic people are underrepresented in officer-initiated raids; Boston’s population is 44.6% white non-Hispanic, but the group of people impacted by all officer-initiated raids are only 6.5% white. In contrast, white people were involved in crisis-related raids at a rate more proportionate to the overall population; 33.5% of those impacted by these raids are white.  

The data: SWAT team after-action reports document frightening, militarized surprise raids 

Reports detail the SWAT team battering down doors, deploying aerosol grenades, waking individuals asleep in bed, and detaining relatives of suspects and children. According to the reports, well over half of the people subjected to this level of force were not even the targets of the operation but were just roommates, partners, family members, or children who were present in the home during the raid.  

SWAT raids can even harm people who live nearby a person wanted by police. One of the records details a raid where the entire household was not the target of the operation; the SWAT team failed to go to the correct address on a search warrant and wrongfully invaded another family’s home. In 2018, the ACLU of Massachusetts represented this family in a lawsuit against the BPD. As our lawsuit on behalf of the family alleged, “[the BPD SWAT team] used a battering ram to break down the door, trained guns on and handcuffed the parents ... and their 15-year-old child, and ransacked the home with two younger children present.” The family suffered lasting emotional distress from this assault. Ultimately, the case was settled and the City was forced to pay the family $500,000.  

If you are interested in learning more about the practices of the BPD SWAT team, please use the interactive BPD SWAT records review tool. In addition to exploring the data, you can also read the original after-action reports, which include a narrative description of the incident at the end of each document. Please don’t hesitate to contact data4justice@aclum.org with any significant findings.

Review Boston Police SWAT After-Action Reports

Data Notes and Methodology

The original incident reports were made public as non-machine-readable PDFs. Therefore, the first task of this project involved determining how to extract information from these files in a usable format. Volunteer data scientists began by OCR-ing and processing the PDF files to extract useful fields from the documents. Due to the nature of the PDFs and occasional image quality issues, the programmatic data processing and extraction of these reports was subject to error. As a final measure to address any errors and ensure overall data quality, selected fields were manually reviewed and updated by volunteers. For additional data documentation please see the “data notes” section of the BPD SWAT tool.  

This data extraction project was possible with the support of: 

  • Tarak Shah, Human Rights Data Analysis Group — programmatically extracted data from the after-action report PDFs 
  • Aaron Boxer, ACLU-MA volunteer — conducted data extraction, processing, manual entry, and analysis 
  • Natasha Ceol, ACLU-MA volunteer — assisted with data quality-checking and redaction of the after-action reports.  

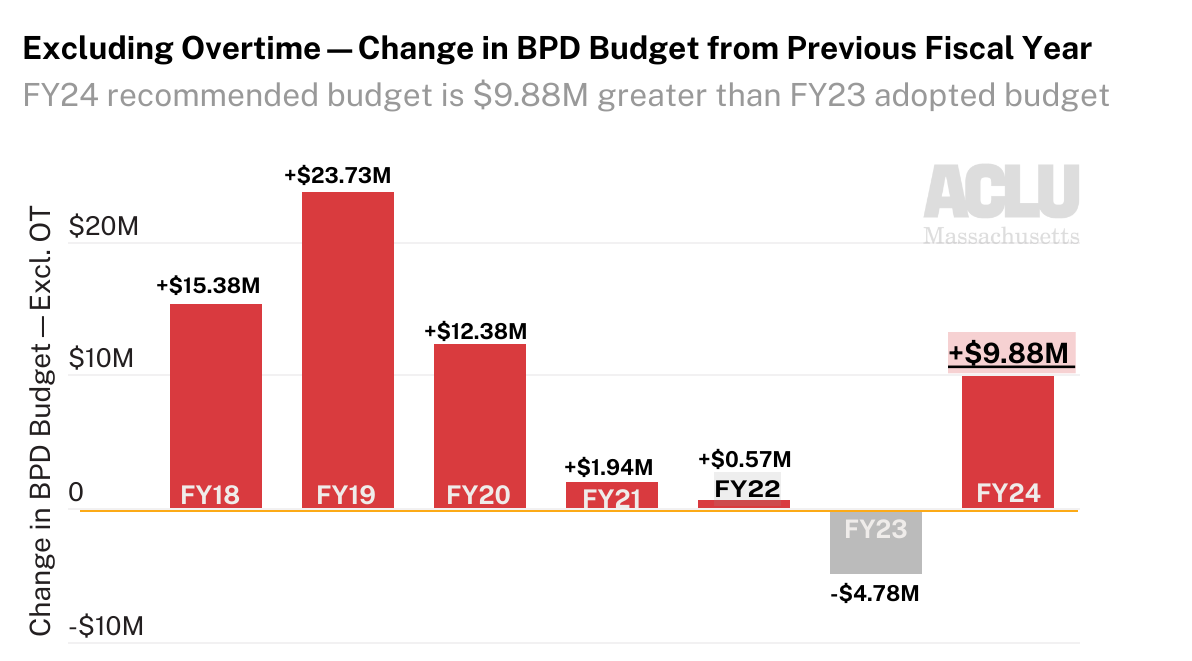
Analyzing Mayor Wu’s FY24 Boston Police Department Budget Recommendation

See our previous work on policing in Massachusetts

On April 12, Mayor Wu submitted her recommended operating budget for the upcoming fiscal year (FY24) to the Boston City Council, kicking off the public portion of the City’s budgeting process. Among other investments, the Mayor’s budget proposes funding the police department at $9.88 million over its FY23 budget. 

Over the coming months, the City Council will review the Mayor’s budget recommendation and can propose and vote on changes. During this same review period last year for the FY23 budget, the City Council unanimously proposed reducing funding for the police department and increasing funding for youth engagement and employment programming, among other proposed changes. These efforts had a limited impact in 2023, however. The Mayor’s budget passed with a few small tweaks from the Council.  

This analysis focuses on the Boston Police Department’s (BPD) budget. Our hope is that this breakdown will be useful for community members, journalists, and other interested parties as the City’s various stakeholders and residents engage in conversations and debate on the budget, which are set to take place between now and July. To explore the full recommended operating budget and design your own changes, please see our (Co)Design the Boston Budget calculator tool.


The Mayor’s proposal would increase the Police Department budget by $9.88 million

Of the $4.28 billion city operating budget, the Mayor’s recommended budget allocates $404.97 million to the Boston Police Department.  

The recommendation is an increase of $9.88 million from last year’s BPD adopted budget of $395.09 million. (Note: the City’s recommended budget document describes this as a smaller $9 million increase for the BPD budget, comparing the Mayor’s FY24 recommendation to the FY23 appropriation of $395.91 million rather than the FY23 adopted budget of $395.09 million. This analysis compares the FY24 recommended budget to the adopted budget of previous years, not the appropriated budgets.)

In adopted BPD budgets of recent years, there have been significant reductions to the police overtime line item; notably, this FY24 recommended budget does not make additional changes to police overtime. The FY21 and FY22 budgets both significantly reduced the overtime line item from previous fiscal years, and both the FY23 adopted budget and FY24 recommendation preserve those cuts. However, police overtime spending is not constrained by a reduction in the line-item overtime allocation; all police overtime is paid by the city even when it exceeds its appropriation. Since actual overtime spending frequently surpasses its budget line item, the analysis below compares the Mayor’s FY24 BPD budget recommendation both in its entirety and with the overtime line item excluded. 

When excluding the overtime budget, the remaining portion of the Mayor’s recommended FY24 BPD budget is the largest in recent years.  

The proposed increase in the FY24 police budget represents a shift. In the past few years since 2020, the growth of BPD’s adopted budget has curbed in response to community calls to shift funds from policing into community health and safety initiatives. When excluding the overtime line item, the $12.38 million increase between FY19-FY20 was followed by much lower increases of $1.94 million between FY20-FY21 and $0.57 million between FY21-FY22. Last year’s FY23 adopted budget, also proposed by Mayor Wu, showed a reduction of $4.78 million from the FY22 budget—the first such reduction to non-overtime sections of the budget since at least FY15. An increase of $9.88 million for FY24 would break from the trend of the past few years. 


Where is this additional money going?

The bulk of the Mayor’s proposed budget increase for BPD provides funding for police department staff. According to the City’s budget documents, the FY24 recommended budget would fund “a recruit class to replace project attrition” and $582,000 to the Youth Connect program, which provides social workers for police precincts. Last year’s FY23 budget also increased the size of the police cadet class from 60 to 90; it appears that this budget preserves that increase. 

Here’s how the BPD’s staffing levels under the FY24 recommendation would compare to other city departments, excluding the Boston Public Schools. 

The Mayor’s budget recommendation proposes 2,766 full-time equivalent employees (FTE) at BPD on 1/1/24. This represents: 

    • 3.3x the FTEs of the Public Health Commission 
    • 7x the FTEs of the Public Library 
    • 10.3x the FTEs of the Boston Center for Youth & Families 
    • 11.8x the FTEs of Parks and Recreation 

This is an increase of 108.6 full-time equivalent employees compared to 1/1/23, though as city documents note, it is important to bear in mind that the number of employees on January 1 of a given year often varies due to retirement timing and the start of new classes. Budget documents describe this change in staff levels along these lines—as a reflection of last year’s police class being delayed until April 2023. 

The size of BPD’s full-time equivalent staff exceeds not just departments but entire city cabinets. The police department is larger than every cabinet besides Education and its own Public Safety cabinet. 

Boston has typically had higher-than-average police staffing. As we previously demonstrated using FBI UCR data, in 2021 Boston had more officers per resident than 70 percent of similarly sized cities. 

BPD has a higher budget than every city department other than Boston Public Schools

Year after year, the Boston Police Department has the second-largest budget of any department, second only to the Boston Public Schools.

Note: The chart above excludes Boston Public Schools, which has a FY24 recommended budget of $1.45 billion. 

Just as the size of the police department staff surpasses nearly all other departments and cabinets, so does the size of its budget. Per the Mayor’s recommended FY24 budget, the BPD budget would be: 

    • 3.2x the size of the Public Health Commission 
    • 8.5x the size of the Library Department 
    • 9.9x the size the Environment, Energy, & Open Space Cabinet 
    • 13.5x the size of the Boston Center for Youth & Families 
    • 22.5x the size of Youth Employment and Opportunity 

Boston Police Department overtime spending

The police department’s funds extend beyond the already-sizable adopted budget; the City pays all overtime costs that the police department incurs even when they exceed the initial budgeted amount. And as we’ve documented the police also receive large amounts of grant funding from the state and federal governments each year. 

The department continually exceeds its overtime appropriation. Last year’s overage was particularly substantial, since the FY22 police overtime budget was reduced on paper but actual police expenditures did not decline accordingly. The department spent $72.33M on overtime: similar to previous years’ overtime spending but $28.41M more than budgeted. 

To put this overage in perspective, the difference between BPD’s budgeted overtime allocation and its actual overtime spending in one year could fund not just departments but entire City cabinets. $28.41M is enough to cover the FY22 expenditures for the Cabinets of Equity and Inclusion ($9.8M), Economic Opportunity and Inclusion ($7.6M), Community Engagement ($4.22M), Arts and Culture ($3.50M), and Office of Police Transparency and Accountability ($718K) combined, with a couple million to spare. This FY22 overage is also over half of the Boston Public Library’s budget. 

For more on BPD payroll and overtime during the 2022 calendar year, please see our previous analysis. 


Data Sources

  • Boston’s City budget website  
    • Current and past fiscal year budgets at bottom of page; information was obtained from the “operating budget” and “public safety cabinet” sections of the budget documents 


Explore the FY24 budget recommendation

(Co)Design the Boston Budget – Budget Calculator

How to get involved

  • Members of the public may testify at City Council hearings on the budget, which started this week and will continue through early June. Public testimony, including virtual public testimony, will be accepted at each hearing and at the public testimony hearings.  
    • Resources
    • Schedule for BPD budget hearings, public testimony, and working sessions as of 5/5/23. These are subject to change—confirm hearing dates and times through Public Notice. Both the Ianella Chamber and Piemonte Room are on the Fifth Floor of Boston City Hall: 
      • Thursday, May 11 at 10am (Iannella Chamber)Hearing: BPD Revolving Funds 
      • Thursday, May 11 at 2pm (Iannella Chamber)Hearing: Grants, Reform, Community Programs, and Crisis Response 
      • Thursday, May 17 at 6pm (Iannella Chamber)Public Testimony: BPD, BFD, Safety, BEMS 
      • Tuesday, May 30 at 2pm (Piemonte Room) – Amendments Working Session: BFD, BPD 


The analysis benefitted from feedback and input from Fatema Ahmad (MJL), Lauren Chambers (UC Berkeley I School; ACLUM), and Youth Justice and Power Union. Data analysis was informed by work done in collaboration with Boston University students under the supervision of the BU Spark! Program.


Looking Back at the FY2023 Boston Police Department Budget

See our previous work on policing in Massachusetts

Mass nationwide mobilization in 2020 against policing violence and the anti-Black criminal legal system intensified calls for government action against police abuse. Among many other things, this organizing brought heightened public attention to municipal police budgets. In Boston, groups including Muslim Justice League, Families for Justice as Healing, Youth Justice and Power Union, Asian American Resource Workshop, Boston Cyclists Union, The City School, and Boston Liberation Health have in recent years called on the City Council and Mayor to shift funds from the Boston Police Department into community safety and wellness programs. 

The City of Boston is soon approaching budget season for the upcoming fiscal year; the Mayor’s proposed FY2024 budget is expected to be filed by April 12. To help inform the forthcoming conversations around the proposed budget for next year, Boston University’s Spark! Lab and the ACLU of Massachusetts analyzed the FY2023 (2022-2023) budget for the Boston Police Department. 

This analysis shows that the adopted FY2023 police budget, which is 1.19% smaller than in FY2022, is similar to previous years.


The FY2023 Boston Police Department budget is slightly smaller than previous years 

The total FY2023 City of Boston operating budget is $3.99 billion. Of this, the Boston Police Department (BPD) is budgeted $395 million  

The FY2023 BPD budget is 1.19% smaller than the department’s near-$400 million FY2022 budget. 

According to the City, these budget reductions primarily result from a lower budget for salaries because younger officers are replacing older officers. In addition, the Mayor postponed an academy class by one month, saving the city $1 million. 

However, the number of police officers in the budget increased in the FY2023 budget, as did the number of 18-25 year olds in a cadet program designed to train people who will apply to become police officers in the future. In addition, contract negotiations are underway with the police associations. If the city agrees to retroactive pay increases, then the existing contracts would retroactively increase the FY2021, FY2022, and FY2023 budgets and potentially reverse reductions in those budgets. 

Unlike the past few years, the FY2023 BPD budget reduction was not due to a reduction in the overtime line item 

Looking back at previous years, the slight reduction in the adopted Police Department budget between FY2020 and FY2022 can be attributed to reductions in budgeted police overtime. Reductions in the overtime budget outweighed increases in other areas and contributed to a small overall decline in the total size of the department budget.  

However, these reductions in the overtime budget have a limited impact on decreasing police spending, because the City is required to pay whatever overtime is incurred regardless of what is budgeted. In fact, actual overtime expenditures regularly exceed the budgeted amount, including in FY2020, FY2021, and FY2022. While the overtime budget decreased from FY2020-FY2021 and FY2021-FY2022 by $12 million and $4.88 million, respectively, actual overtime spending decreased by $6.48 million and (based on City estimates in May 2022) $1.4 million, respectively. Real overtime cuts will require both contract reforms as well as overhauling BPD’s practices around overtime. 

This FY2023 budget reduction is notable in that the $4.78 million decrease in the BPD budget is not due to a decrease in the overtime line item.  

When disregarding the overtime line item, the remaining BPD budget has been stable in recent years. It increased slightly from FY2020 to FY2022 and decreased slightly in FY2023. FY2023 is the first year since at least FY2015 that the non-overtime sections of the BPD budget decreased. 

The Boston Police Department budget is the second-largest line item in the entire budget, second only to Boston Public Schools 

The Boston Police Department’s $395 million budget makes up nearly 10% of the entire City of Boston operating budget. In comparison with other City departments, it is: 

  • 13.84 times the size of the Parks Department 
  • 9.13 times the size of the Library Department 
  • 3.35 times the size of the Public Health Commission 
  • 1.43 times the size of the Fire Department 

The City pays more for policing than what is reflected in the operating budget 

Yet the amount allocated to the police in the operating budget is not the full picture of BPD’s funds. City employee benefits, overtime, and external funding all contribute to department resources: 

  • As detailed by Citizens for Juvenile Justice’s Hidden Costs of Policing report, the City pays separately towards pension and health insurance for police department staff. Although these costs fall outside the operating budget and are not reflected in this analysis, they are a significant part of the full cost of operating the Boston Police Department. The Hidden Costs of Policing report shows that this expense was over $168 million in FY2021. 
  • With police overtime overages, the City regularly pays more to BPD than the adopted budget amount. In FY2021, over $68.2 million of overtime was incurred, which was $19.4 million more than what was budgeted. Due to the City’s interpretation of an exception in the Boston charter, the amount spent on police overtime—even if it exceeds the budget—is always paid out. For more on this exception, please see our April 2021 analysis. 

Thus, the full operational costs of the Boston Police Department are even greater than the already-extensive operating budget (and greater than what is reflected in this analysis here). 

In 2022, 1 in 5 of the City’s payroll dollars went to BPD

The Boston Police Department’s payroll totaled $405 million in the 2022 calendar year, according to the City’s employee earnings report.  

This figure includes more than just base salary and overtime. The earnings report shows payroll earnings from all the following categories: paid detail, injured, overtime, education incentive, regular, retro, and other (including from bonus incentives, grievance/settlements, stipends, and reimbursements).


To put this $405 million figure in perspective, the size of the Police Department payroll was: 

  • 20.88 times the size of Parks Department 
  • 13.53 times the size of the Public Library 
  • 1.46 times the size of the Fire Department 

High payroll costs stemmed from both the large size of the department and the higher-than-average pay of employees—Boston Police Department employees made up 13% of the City’s total employees but department payroll made up 21% of the City’s total payroll.  

See below for distribution of department regular, overtime, and detail pay in 2022. 

Police Department overtime expenditures regularly exceed the budgeted amount and fuel high payroll costs 

BPD has exceeded their overtime budget in previous years. As of the May 2022 City Council hearing on the BPD budget, the department had already surpassed their FY2022 overtime budget by $10 million. At that time, it was anticipated that by the end of the fiscal year, overtime expenditures would be $66.8 million, $22.9 million over the $43.9 million budgeted for overtime spending. The City finds money to fund this police overspending every year—a privilege that is generally not afforded to other city departments. 

Overtime spending and overspending does not occur by accident. In a December 2015 report, an audit of BPD described “overtime banks” with a planned number of hours in each district and specialized unit used to assign overtime to officers. Rather than just paying for unplanned emergency spending, the department plans in advance to use many overtime hours rather than managing the allotted overtime hours to stay within budget. 

The City has yet to publish total overtime spending for FY2022 or to-date spending for FY2023, meaning information about actual overtime budget overages for these fiscal years is still unavailable. However, overtime data for calendar year 2022 is available, and from this we can see that police overtime made up a considerable amount of the City’s overall payroll.  

In 2022, 56% of all City overtime pay went to Boston Police Department employees.


Overtime pay still made up a substantial portion of Police Department employee pay; 19.3% of department payroll was for overtime. While most City employees’ overtime is capped as a percentage of their salary, this is not true of police officers. This leads to very high pay for officers who obtain overtime hours to increase their pay and is a major reason that police regularly are the highest paid employees in the City. Despite the size of this overtime spending, the Police Department has historically not been transparent about its processes for managing overtime. 

Overtime also continues to be a significant contributor to the pay of the department’s top earners. 

Note: As the result of a gender discrimination lawsuit, the city was ordered to pay millions to Donna M. Gavin, who makes the top earner on this list. 

Data suggest hiring more Police Department employees isn’t the solution to overtime spending 

At last year’s BPD budget hearings, City Council President Ed Flynn repeated the suggestion that hiring more police officers would help to address excessive overtime costs. But this idea—that BPD’s overtime problem is caused by a shortage of officers—is not supported by the data.  

Looking at historical budget data, years with more Boston Police Department personnel are actually associated with higher overtime spending. This new finding adds to our 2021 analysis, which measured departmental size as the full-time equivalents (FTEs) at the BPD and found that there was no correlation between number of Police Department FTEs and overtime spending. 

Boston has a larger-than-average police department 

Higher staff numbers at BPD have not reduced overtime spending. But misguided claims about overtime spending aren’t the only reasons some City Councilors are calling for more police officers. To contextualize these calls for more officers, we conducted a review of similarly situated communities to see how Boston stacks up. That review shows the Boston Police Department already has a sizable staff.  

It is a large department when viewed against other cities with comparable population sizes. A review of available FBI UCR data shows that between 2015 and 2021 Boston consistently retained more officers per resident than the average of other similarly sized cities. 

Note: The 23 cities compared were Washington, Baltimore, Detroit, Atlanta, Memphis, Milwaukee, Kansas City, San Francisco, Nashville, Honolulu, Denver, Charlotte, Fort Worth, Albuquerque, El Paso, Oklahoma City, Mesa, Louisville, Seattle, Tucson, Fresno, Sacramento, and Portland. 

In 2021, Boston retained more officers per resident than 70% of other similarly sized cities. 


Overall, the adopted FY2023 budget for police spending was similar to previous years: costly, with a bloated payroll and tens of millions of dollars for overtime. We’ll soon see how the proposed FY2024 budget compares; the first look will come on or before April 12, 2023 when Mayor Wu submits her budget recommendation to the City Council. We plan to share an analysis of that budget proposal after it becomes available. 

Members of the public will have the opportunity to directly share their input on the budget during public hearings, which are expected to be held at the Boston City Council between April and June.


Data Sources

    • Current and past fiscal year budgets at bottom of page; information was obtained from the public safety cabinet section of the budget documents 
    • Law Enforcement Employees data  


This report was authored by Natasha (ACLUM) and Ryan Yap (Boston University). Data analysis was conducted by Boston University students including Ryan Yap, Xiang Li, Zijie Li, and Hayden Rothman under the supervision of the BU Spark! Program based at the BU Faculty of Computing & Data Sciences and led by Ziba Cranmer (BU) with project management support from Yagev Levi.
 

The analysis benefitted from crucial feedback from Fatema Ahmad (MJL), Lauren Chambers (UC Berkeley I School; ACLUM), and Youth Justice and Power Union.


Massachusetts Arrest Records Signal Troubling Racial Disparities

New analysis from students at the Boston University Spark! Lab and the ACLU of Massachusetts Data for Justice Project reveal troubling racial disparities in arrests in communities across Massachusetts. Our analysis uses data newly available thanks to ACLU advocacy in 2018, which led to the inclusion in that year’s omnibus criminal law reform legislation of language mandating the collection and reporting of statewide arrest data.

Section 5 of Chapter 69 of the Massachusetts General Laws requires all police departments to collect and report arrest data statistics to the Executive Office of Public Safety and Security (EOPSS), which is required to post this information online. These records allow residents, researchers, advocates, lawmakers, journalists and other interested parties to see how specific police departments use their arrest powers and enable us to conduct statewide reviews to compare departments to one another.  

Arrests data from 2020 show signs of significant racial disparities.

Our analysis suggests there were significant racial disparities in arrest rates across the state in 2020. After a statewide review of the data, our team identified six cities with unusually high rates of arrest and focused on these communities for more in-depth analysis. When compared to the resident population in the six cities analyzed—Fall River, Chicopee, Holyoke, New Bedford, Springfield, and Worcester—Black and Hispanic people were arrested at a much higher rate than white people.

Of these six cities, New Bedford had the highest arrest rate disparity for Black people; Black people were arrested at 5.2x the rate of white people when compared to share of resident population. The disparity for Hispanic people was highest in Chicopee where Hispanic people were arrested at 2.5x the rate of white people. A statewide comparison shows the same concerning pattern. Across the state in 2020, Black people were arrested at 2.9x the rate of white people, and Hispanic people were arrested at 2x the rate of white people. 

There are some limitations in the data provided by the state. For example, the data do not indicate whether those arrested were residents of the municipality where police made the arrests.1 Nonetheless, comparison of the share of arrests by race to the overall resident population still provides a valuable way to identify potential disparities. Furthermore, the indications of racial disparity are consistent with other reports, such as a 2021 analysis of the same Massachusetts state arrests dataset by NBC10 Boston and students from Boston University’s Justice Media Computational Journalism co-lab. The stark disparities in arrest rates indicated here are considerable and call for continued attention and action. 

We can’t manage what we don’t measure. The reporting of arrest data mandated by the 2018 criminal law reform allows us to identify racial disparities in arrests in communities statewide. But analyzing the data is only the first step.  Cities and towns need to take a close look at their policies, procedures, and police management to understand why these disparities are occurring, and take corrective action to address them.  

Data analysis was conducted by Boston University students including Nikoloz Rapava, Sheila Yee, Natalia Clark, and Xi Li under the supervision of the BU Spark! Program based at the BU Faculty of Computing & Data Sciences and led by Ziba Cranmer (BU) with project management support from Della Lin (Project Manager). This work was done in collaboration with ACLUM.


1 Since the data do not indicate whether or not the arrestee was a resident of the location where they were arrested, the analysis was tested under the case that some portion of arrestees resided in a different part of the state. Even with this modification, Black and Hispanic people were arrested at a much higher rate than white people.

Below is the analysis of arrest rates disparities for Black and Hispanic people assuming 10% of those arrested were residents of any part of the greater county or state.


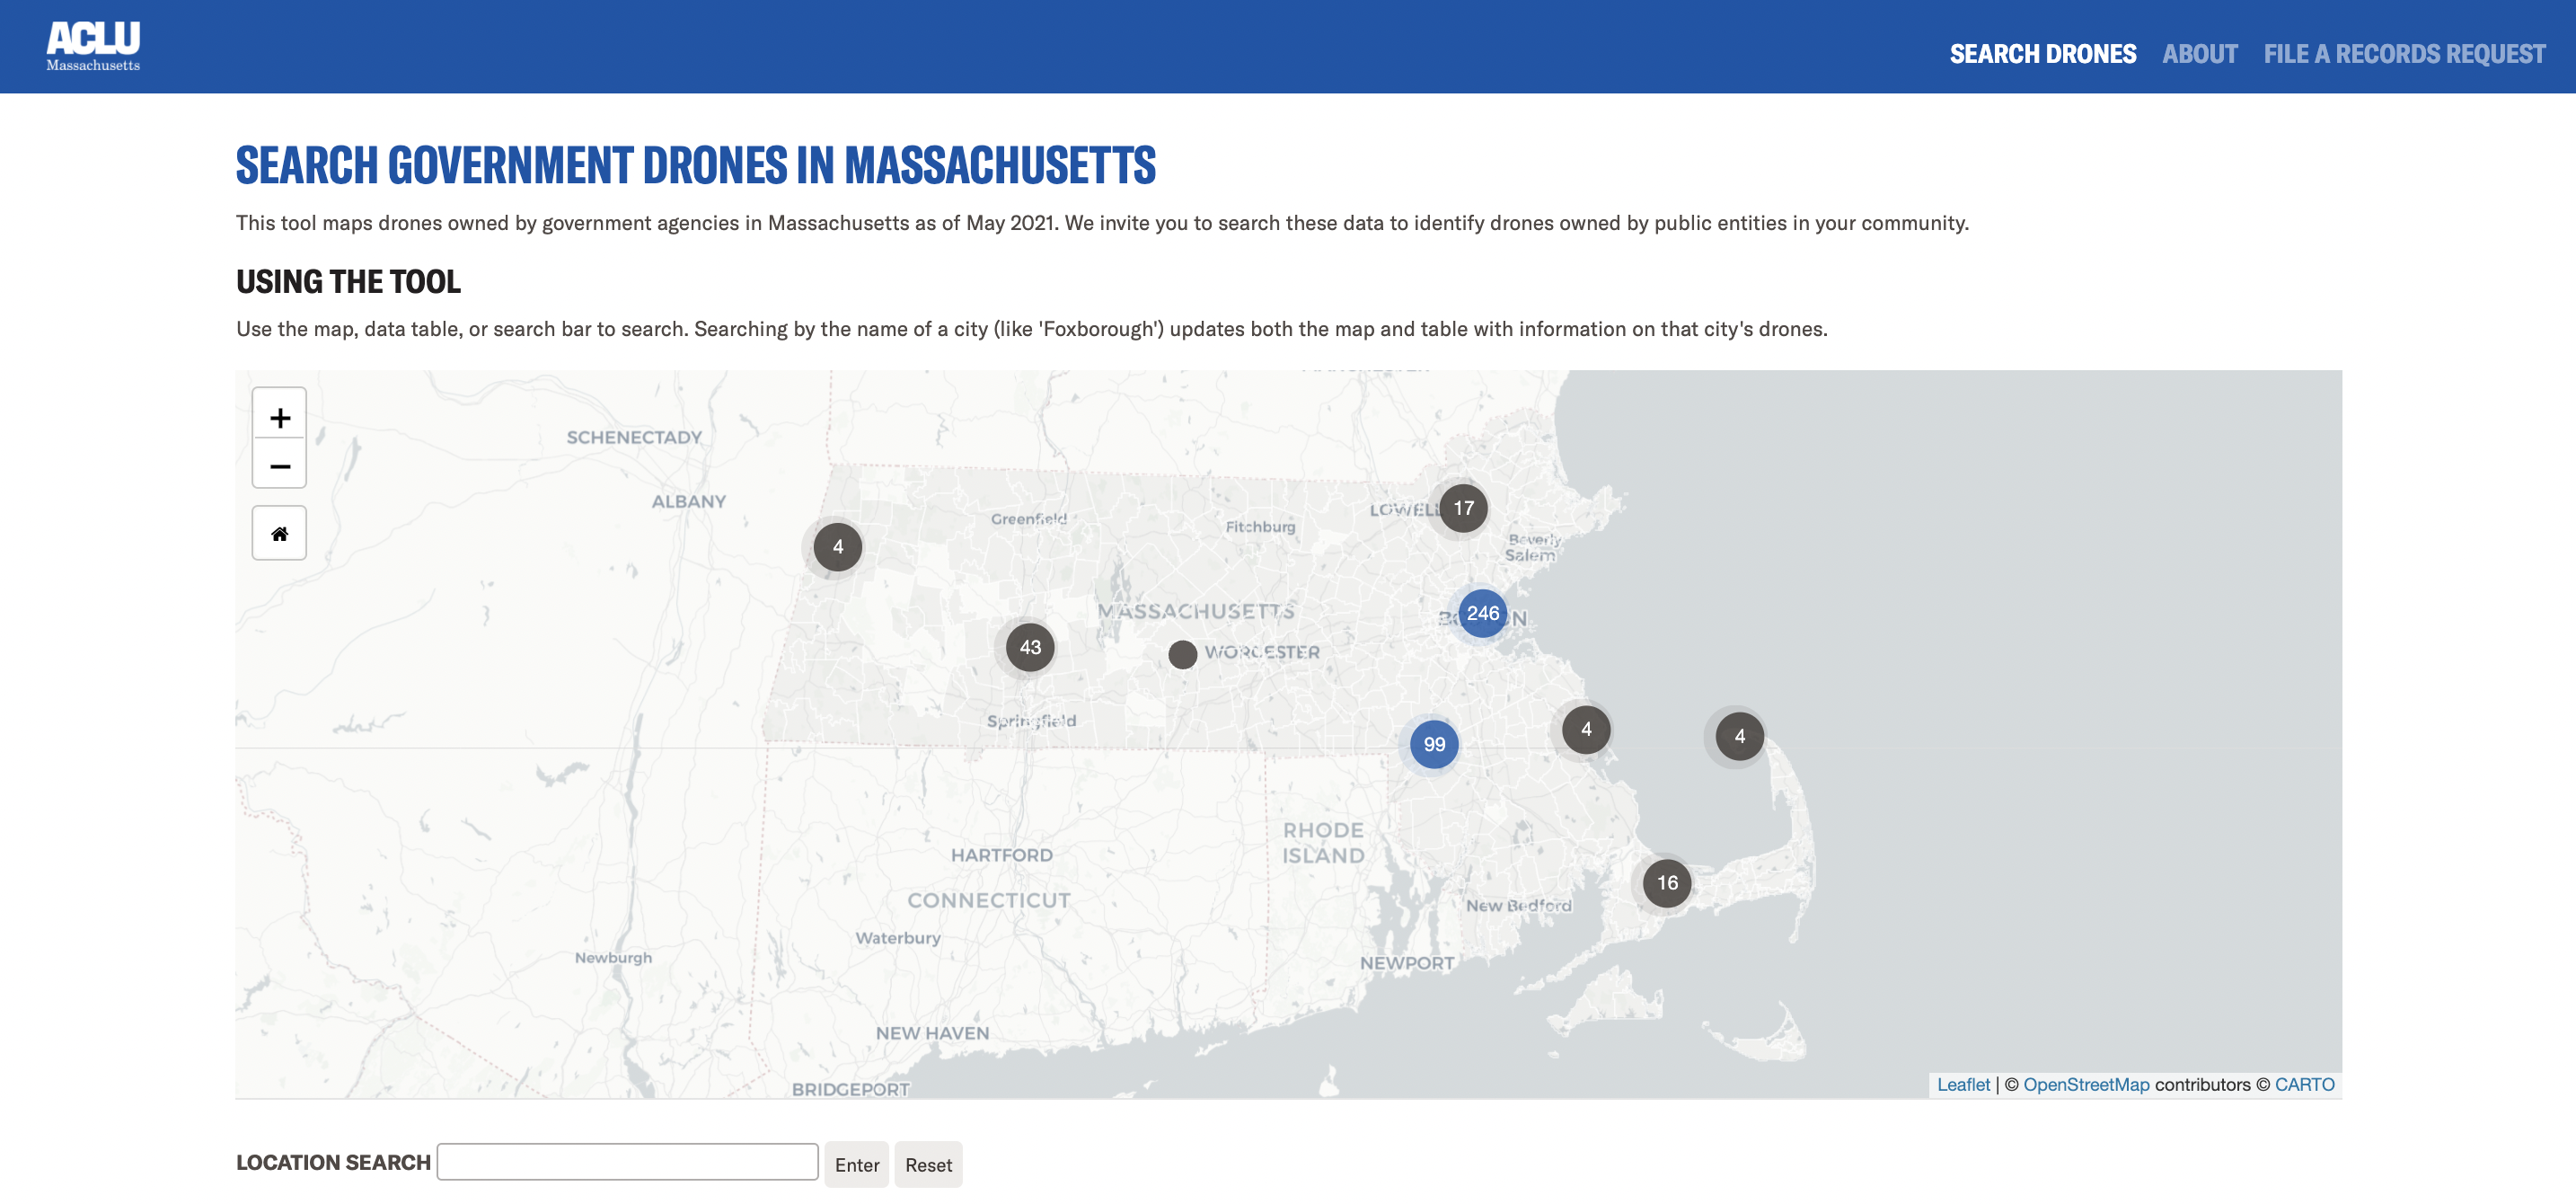
Eyes in the Sky: Data Reveal Which Mass. Government Agencies Use Drones

Today, the ACLU of Massachusetts published new data on drones owned and operated by government agencies in Massachusetts. The dataset includes 431 drones (a.k.a. unmanned aircraft systems) along with their model types, physical locations, and agency ownership. The ACLU has created an interactive tool so anyone can explore the dataset and identify drones owned by public entities in their own communities. 

Search Government Drones in Massachusetts

Public records request to the Federal Aviation Administration

The Federal Aviation Administration (FAA) oversees licensing for drones and unmanned aircraft systems nationwide. Before an agency can fly a drone, the device must be registered with the FAA. The FAA’s role in licensing drones makes it relatively easy to determine which government agencies are using them. Instead of filing hundreds of records requests with government agencies across the state, we only had to file one federal Freedom of Information Act (FOIA) request. So, in May 2021, that’s what we did. The data we obtained include drones owned by local and state law enforcement, as well as those owned and operated by other government agencies, like public universities and transportation entities.  

Significant number of drones owned by law enforcement

The data show that Massachusetts police departments own a significant number of drones, with law enforcement drones making up nearly half (42 percent) of all those registered to government agencies in the state. The policing organizations with the greatest number of drones are the Massachusetts State Police, with 81 registered devices, and the Boston Police Department Crime Scene Response Unit, with 18. 


High concentration of government drones in Boston and Foxborough

According to the data, there are 210 government-owned drones in Boston, the highest number of any MA city and almost half of all government-owned drones in the state. Most of these drones—189—are registered in East Boston and owned by the Massachusetts Department of Transportation’s Aeronautics Division.  

Foxborough has the second-highest number of government-owned drones. All but one of the 82 drones registered there are owned and operated by the Massachusetts State Police. 

Controversy with popular drone manufacturer

The most common drone model found in this dataset is  DJI’s Phantom 4with a total of 47 units owned by Massachusetts government organizationsWhile the data do not include specifics about any model’s capabilities or features, DJI advertises that the Phantom 4 haa max flight time of 28 minutes, a max speed of 20 m/s, and includes a camera for still photography and video  

DJI is by far the most popular company with Massachusetts government agencies, representing a whopping 85 percent of all drones documented in the dataset. The company’s strong business with Massachusetts government agencies is notable given that the Trump administration Department of Commerce placed ion the Entity List in December 2020, alleging that the company posed national security concerns and enabled human rights abuses.  

Other drone companies have likewise faced criticism over human rightsA recent report on drone manufacturer Brinc highlighted a promotional video advertising weaponized patrol drones that could be used to target and assault migrants at the southwest border. A bill currently before the Massachusetts state legislature would prohibit the use of weaponized drones in the state, and would require police to get a warrant before using drones for surveillance in most circumstances.

Learning more about government use of drones in Massachusetts

The dataset published here tells us which entities have drones but does not provide information on how or when those drones are usedIf you’re interested in learning about how government agencies in Massachusetts have used drones, you can use our model public records request to find out. More information about this process and resources are available through the tool linked below. 

Search Government Drones in Massachusetts


If you find anything interesting, please reach out to us at data4justice@aclum.org and let us know. 


MA Voter Cutoff Law Disenfranchises Registered Voters

In the wake of preliminary elections for Boston’s mayoral race, we’ve seen a number of plausible explanations for strikingly low turnout across the city. But there’s one aspect of this puzzle that most commentators seem to have overlooked: Although mail-in ballots and early voting make it easier to cast a vote in Massachusetts, significant barriers remain—and if we’re serious about increasing turnout, we need to clear every needless hurdle on the path to ballot access.

That includes Massachusetts’ voter cutoff law—which actively disenfranchises registered voters.

In Massachusetts, the voter registration deadline for any election is a full 20 days prior to the election date. And for elections like Boston’s preliminary, this deadline is in the dead of August—before the most high-profile events, debates, and election-related activities occur. In fact, the voter cutoff for the Boston preliminary mayoral election was a full two weeks before the first televised debate. In recent presidential elections, thousands of eligible voters have been disenfranchised by this arbitrary voter cutoff. Anybody can find themselves on the wrong side of Massachusetts’ voter registration deadline—including people working multiple jobs, people with disabilities, and renters.

Current voter cutoff impacts residents who move

Indeed, Massachusetts’ voter cutoff is just days before Boston’s traditional September 1 apartment turnover date—meaning new Boston residents may have had to sit this election out entirely. Residents who moved within the city may have had to travel to a different neighborhood or precinct to cast their ballot in their old location, as state law allows voters to vote from a previous address for up to six months after moving. Consider, for example, a resident who moves from East Boston to Mattapan before the election; in the absence of updating their voter registration by the state’s arbitrary deadline, that voter must drive across the city to cast a ballot—or take a combination of train, subway, and buses to their old polling location, spending up to two hours simply getting to the polls. Let’s be clear: For voters who rely on public transit, need childcare, or have strict work schedules, the registration deadline pushes voting out of reach for no good reason.

Our team’s analysis shows that the wards with the lowest turnout in this month’s Boston preliminary election also have the greatest proportion of renters. Renters already have lower voting rates than homeowners, for complex reasons we won’t attempt to address here. That’s why the state must do everything in its power to increase those rates, including by passing same day voter registration legislation. Every barrier to voting reduces the likelihood that people will vote, and trends in Boston indicate renters need every push possible to get to the polls on election day. 

Lowest voter turnout from areas with more renters

We know that Massachusetts’ voter cutoff law disproportionately impacts populations that often intersect: people of color, young people, and people with lower incomes. These residents move more frequently due to rising rents, may have subpar Internet access, and often face greater pressures in their daily lives that make it substantially more difficult to meet an abstract, arbitrary registration cutoff—or to travel all the way across town on Election Day to cast their ballot in their old neighborhood.

At a time when other states are rolling back voting rights, Massachusetts lawmakers must continue to do everything they can to make voting as inclusive and accessible as possible. Among other provisions, the VOTES Act includes same day registration, which would allow eligible Massachusetts voters to register to vote or update existing registration on Election Day and during the early voting period. The bill is currently pending before legislators; the preliminary election turnout in Boston underscores its urgency.

Low preliminary turnout in Boston on 9/14

Overall, wards with a higher proportion of renters had lower voter turnout. The maps below compare voter turnout in the Sept 2021 preliminary municipal election with the estimated share of renters in each ward (based on 2019 data). In these maps, percent voter turnout refers to the number of people who voted out of the number of registered voters.

SOURCES: Election results data from Boston Election Dept (https://www.boston.gov/departments/elections). | Renter data from U.S. Census Bureau, American Community Survey, 2019 5-year estimates (2015-2019); Table B25033. | Voting age population data from U.S. Census Bureau, Decennial Census, 2020: DEC Redistricting Data (PL 94-171); Table P3″. | Ward boundaries from Analyze Boston (https://data.boston.gov/dataset/wards)

DATA ANALYSIS : ACLU of Massachusetts

Overall, wards with a higher proportion of renters had lower voter turnout. The maps below compare voter turnout in the Sept 2021 preliminary municipal election with the estimated share of renters in each ward (based on 2019 data). In these maps, percent voter turnout refers to the number of people who voted out of the ward’s adult (18+) population.

SOURCES: Election results data from Boston Election Dept (https://www.boston.gov/departments/elections). | Renter data from U.S. Census Bureau, American Community Survey, 2019 5-year estimates (2015-2019); Table B25033. | Voting age population data from U.S. Census Bureau, Decennial Census, 2020: DEC Redistricting Data (PL 94-171); Table P3″. | Ward boundaries from Analyze Boston (https://data.boston.gov/dataset/wards)

DATA ANALYSIS : ACLU of Massachusetts

Governor Baker recently said he opposes same day registration because of “the complexity associated with it.” But the truth is, Massachusetts’ voter cutoff law makes accessing the ballot too complex for tens of thousands of people—and same day registration is a simple solution. Same day registration was first implemented in the United States in 1973—nearly 50 years ago. Since then, 20 other states and Washington, D.C. have implemented same day registration. Those states, including our neighbors in Connecticut, New Hampshire, Maine, and Vermont, report fewer burdens on local election officials and improved voter turnout.

The very communities harmed by Massachusetts’ voter cutoff law would benefit from same day registration. A recent University of Massachusetts study found that same day registration often creates higher turnout among Black and Latinx voters. Other researchers estimate that same day registration could increase turnout for those who have moved in the last six months by nearly 8 percent. And same day registration eases burdens for young adults and elderly populations alike.

Our democracy works best when all qualified voters are able to participate fully—and that simply is not the case in Massachusetts today. Low voter turnout is always cause for concern, and there are likely many factors that play into it—but there’s no excuse to maintain a law that makes it harder for voters to cast their ballot. It’s past time to enact same day registration in Massachusetts.