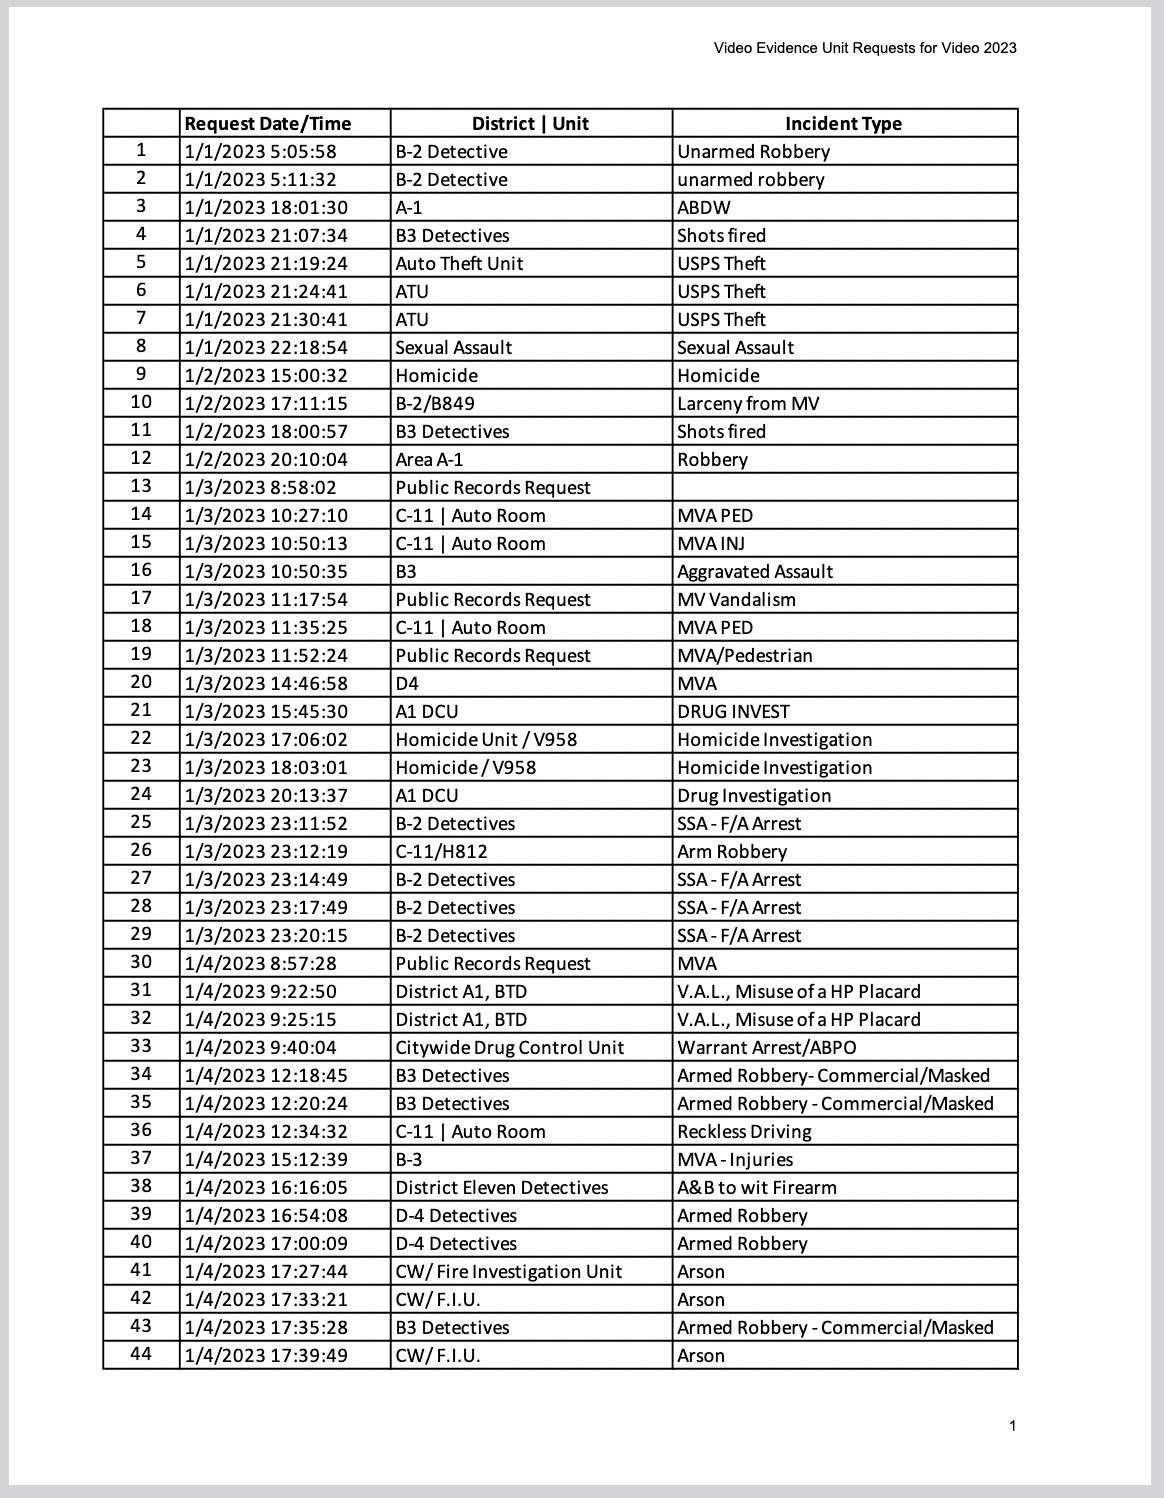
You can explore more details about requests for surveillance video footage broken down by unit below:
This chart shows the top 15 police units that requested surveillance video from the Video Evidence Unit in 2023.
These are a subset of the 3,293 requests in the video request log which also included 1,062 public records requests.
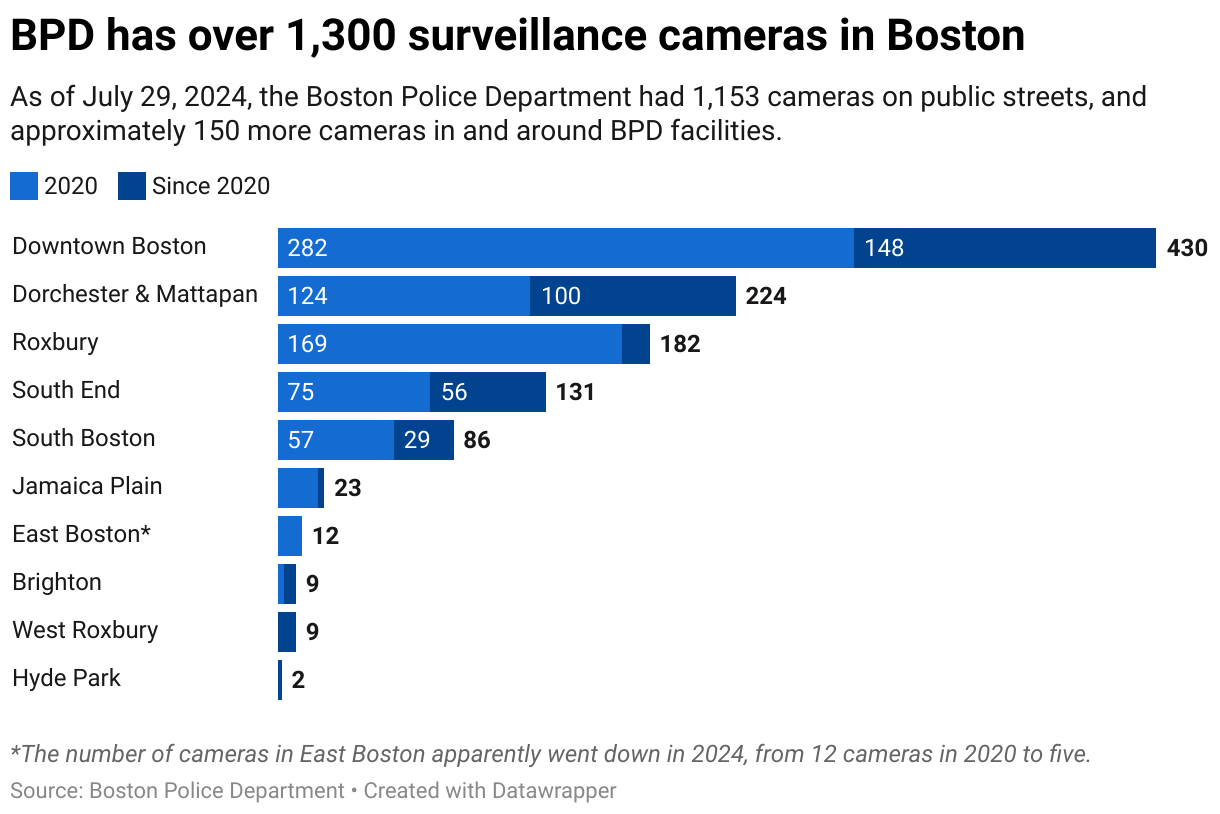
Police claims about benefits of surveillance cameras deserve more scrutiny
Police usually justify the use of surveillance cameras with two arguments: first, that surveillance cameras help deter crimes; and second, that surveillance cameras help solve crimes. But they rarely provide evidence for these claims.
When it comes to the question of deterrence, a meta-analysis of 24 studies over 40 years found that surveillance cameras did not significantly reduce crime in the US. But even if cameras don’t deter crimes, police often point to a different argument: surveillance footage helps them solve crimes after the fact. Does the data support this claim?
In short, no. In London, one of the most heavily surveilled cities in the world, an internal report found that police only solved one crime for every 1,000 cameras in the city. In Boston, we have known relatively little about how police use their vast surveillance camera network — until recently.
Zooming in: Cameras and homicide clearance rates in Boston
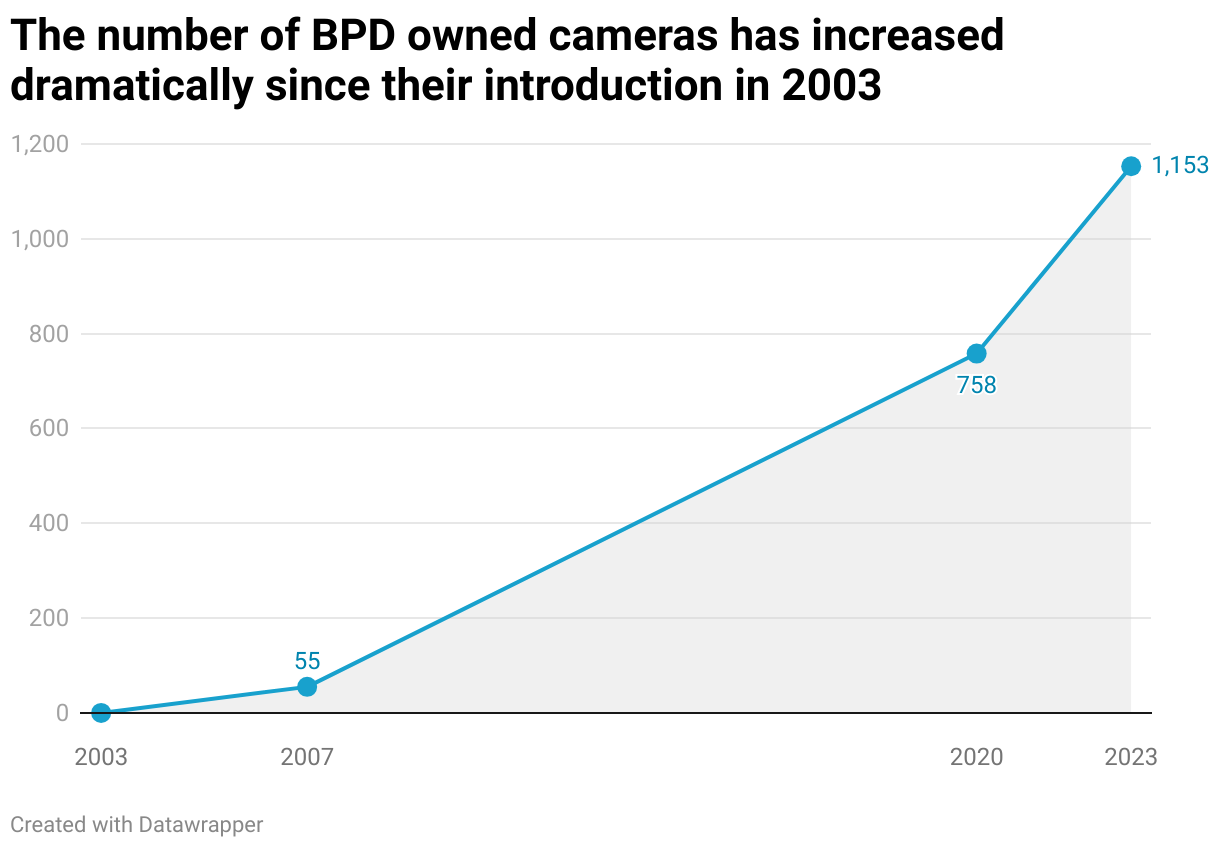
The first of the DHS-funded surveillance cameras in Boston were installed in 2004. Since then, the BPD and other police departments in the Greater Boston area have vastly expanded their surveillance toolkit. While the police say surveillance technologies like cameras are an integral part of their investigations and vital to solving serious crimes, we wanted to test this claim. So, we started with the most serious of crimes: homicides.
While Boston has one of the lowest murder rates in the country, to our knowledge, there is no evidence that surveillance cameras have played a part in that success story. But have cameras been a game changer in solving homicides after the fact? Again, the BPD did not provide us with enough information to answer this question conclusively. However, we can look at homicide clearance rates and the growth of surveillance in Boston to see if there is any correlation.
The data shows that, despite the explosive growth of camera surveillance in Boston over the past twenty years, homicides often remain unsolved, and there hasn’t been a dramatic improvement in the proportion of solved (“cleared”) cases since the introduction of surveillance cameras in 2004.
In 2003, the year before the first of the DHS-funded cameras were installed, the police cleared more than half of all homicides in the city. But 1,300+ cameras later, the clearance rate is not much higher than when it started, at 58% cleared in 2024.
In fact, Boston's clearance rate is consistently lower than the national average, despite a concurrent massive expansion of the BPD’s surveillance ecosystem, which includes not just surveillance cameras but also license plate readers, the “ShotSpotter” gunshot detection system, and the Boston Regional Intelligence Center (BRIC).
More data is necessary to understand the utility of camera surveillance to BPD investigations
Per the ordinance, Boston must publish its annual surveillance report every year by May 31. Last year, the city did not release its report until July — and this year it is also late to report. We will update this page when the latest report becomes available.
In the meantime, the BPD should share more information about its camera surveillance with the public. While the findings laid out above are interesting, absent more detailed information about how the footage was used, Boston residents and city councilors overseeing the BPD’s surveillance programs can’t gauge whether these cameras are worth the civil liberties infringements or financial cost. We need more data — specifically, when footage was ultimately used to charge or convict someone, and whether it was instrumental in this process. The number of times that camera footage was useful to police is likely lower, perhaps far lower, than the total number of requests.
The surveillance ecosystem in Boston keeps growing, too often without evidence-based justification. Though police do share anecdotes about the utility of surveillance cameras, we do not have comprehensive data to support the broader claim that surveillance increases safety. And the data we do have indicates that cameras are not the miracle crime solving technology that CSI and other television shows would have us believe.
Here’s what we do know: coupled with artificial intelligence enabling automated analysis, surveillance camera networks pose serious threats to our basic civil liberties. While Boston City Council recognized the harms and pitfalls of facial recognition in 2020 — and banned its use — few Bostonians are aware that similar technologies enabling dystopian tracking are still operational. With software like BriefCam, police can automatically track people, vehicles and other objects across multiple cameras, essentially enabling real-time and historical mass surveillance. Despite the grave risks posed by such technologies, the BPD provided zero information to the public in last year’s surveillance report about its use of BriefCam.
Looking ahead, we urge the BPD to include in its annual reporting the following information:
-
Comprehensive data showing when, and in which types of criminal investigations, surveillance cameras were instrumental in leading to arrests and convictions.
-
Audit logs showing how often, and for what reasons, BPD and BRIC employees used BriefCam to automate the tracking of people or objects across the city’s vast camera network.
The surveillance oversight ordinance was designed to inform residents and policymakers about the actual impacts of surveillance technologies on our communities. While we have made significant progress towards that end, we still have work to do. Join us in calling on the BPD to make more detailed information available so we can judge their claims about surveillance efficacy against the actual data.
Julie J Lee led data analysis, data visualizations and writing, with thanks to Kade Crockford for comments. Renee Perpignan developed the front-end for the initial implementation of the scrolling visualization.